Transient SSS100509:070018-342030
RA           Dec (2000)
105.07327      -34.34167
Rough Mag:
15.5
Discovery data
Current lightcurve
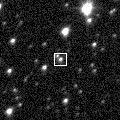
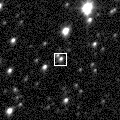
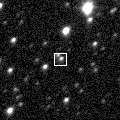
Pre and post-discovery SSS images
SDSS data
Images from other surveys
P60 Follow-up
Pre-discovery 3.6' Siding Spring Survey coadd image (transient location marked with 0)
N is towards the top and E is to the left.
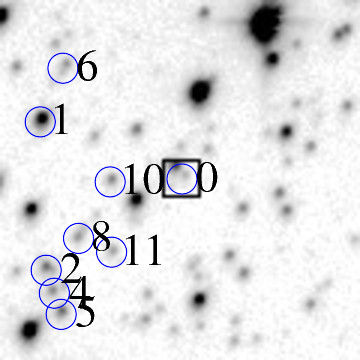
ID    RA         Dec (2000)      mag      delmag    delra (")    deldec (")  PA (deg)

0    105.07327     -34.34167      15.5     0.0        0.0         0.0       0.0
1    105.10215     -34.33240      15.0    -0.5       85.8        33.4      68.8
2    105.10097     -34.35708      16.6     1.2       82.3       -55.5     124.0
4    105.09932     -34.36091      17.1     1.6       77.4       -69.3     131.8
5    105.09796     -34.36443      16.8     1.4       73.4       -81.9     138.1
6    105.09756     -34.32347      17.4     2.0       72.2        65.5      47.8
8    105.09444     -34.35179      17.3     1.9       62.9       -36.4     120.1
10    105.08806     -34.34240      17.2     1.7       44.0        -2.6      93.4
11    105.08777     -34.35408      18.0     2.5       43.1       -44.7     136.0
12    105.08305     -34.34577      15.0    -0.5       29.1       -14.8     116.9
13    105.08301     -34.33395      17.0     1.6       29.0        27.8      46.2
14    105.08104     -34.36566      17.7     2.2       23.1       -86.4     165.0
18    105.07508     -34.33999      16.1     0.7        5.4         6.0      41.7
20    105.07141     -34.35636      18.0     2.5       -5.5       -52.9     186.0
21    105.07030     -34.32757      12.8    -2.7       -8.8        50.8     350.1
22    105.07023     -34.36238      15.2    -0.3       -9.0       -74.6     186.9
28    105.06397     -34.35485      17.3     1.9      -27.6       -47.4     210.2
31    105.06155     -34.34711      17.2     1.8      -34.8       -19.6     240.7
32    105.06118     -34.35778      17.5     2.1      -35.9       -58.0     211.8
34    105.05581     -34.32206      14.8    -0.7      -51.9        70.6     323.7
35    105.05413     -34.34438      17.3     1.8      -56.9        -9.8     260.3
36    105.05296     -34.33433      15.5     0.1      -60.4        26.4     293.6
37    105.05264     -34.34724      16.9     1.4      -61.3       -20.1     251.9
39    105.05094     -34.31951      17.1     1.7      -66.4        79.8     320.2
41    105.04809     -34.33648      17.7     2.3      -74.8        18.7     284.0
42    105.04781     -34.36287      17.6     2.2      -75.7       -76.3     224.8
| Image 1 | Image 2 |
 |
 |
| Image 3 | Image 4 |
 |
 |