Transient SSS111027:195604-341422
RA           Dec (2000)
299.01563      -34.23933
Rough Mag:
16.9
Discovery data
Current lightcurve
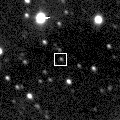
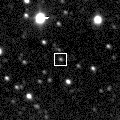
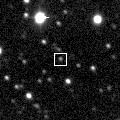
Pre and post-discovery SSS images
SDSS data
Images from other surveys
P60 Follow-up
Pre-discovery 3.6' Siding Spring Survey coadd image (transient location marked with 0)
N is towards the top and E is to the left.
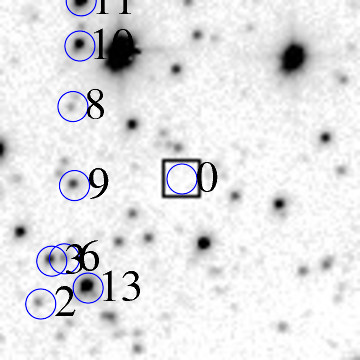
ID    RA         Dec (2000)      mag      delmag    delra (")    deldec (")  PA (deg)

0    299.01563     -34.23933      16.9     0.0        0.0         0.0       0.0
2    299.04445     -34.26030      17.9     1.0       85.8       -75.5     131.4
3    299.04221     -34.25318      16.5    -0.3       79.1       -49.9     122.2
6    299.03966     -34.25280      17.9     1.0       71.5       -48.5     124.1
8    299.03785     -34.22745      17.8     0.9       66.1        42.8      57.1
9    299.03759     -34.24061      17.0     0.2       65.4        -4.6      94.0
10    299.03641     -34.21737      15.6    -1.2       61.8        79.1      38.0
13    299.03491     -34.25768      14.4    -2.4       57.4       -66.1     139.0
14    299.03017     -34.26280      16.8    -0.1       43.3       -84.5     152.9
15    299.02839     -34.25028      17.3     0.4       38.0       -39.4     136.1
16    299.02703     -34.21862      10.2    -6.6       33.9        74.6      24.5
18    299.02574     -34.23072      16.1    -0.8       30.1        31.0      44.1
19    299.02569     -34.24559      17.5     0.7       29.9       -22.5     127.0
22    299.02239     -34.24963      17.2     0.3       20.1       -37.1     151.5
24    299.01708     -34.23445      17.2     0.4        4.3        17.6      13.8
25    299.01683     -34.22151      16.6    -0.3        3.6        64.2       3.2
27    299.01273     -34.21580      17.2     0.3       -8.6        84.7     354.2
28    299.01119     -34.25051      14.9    -1.9      -13.2       -40.2     198.2
29    299.00491     -34.24262      17.1     0.3      -31.9       -11.8     249.6
30    298.99607     -34.24399      15.9    -0.9      -58.2       -16.8     253.9
32    298.99327     -34.21953      11.7    -5.1      -66.5        71.3     317.0
33    298.99128     -34.25511      17.7     0.8      -72.5       -56.8     231.9
34    298.98681     -34.23289      16.4    -0.5      -85.8        23.2     285.1
35    298.98644     -34.25400      17.4     0.5      -86.9       -52.8     238.7
| Image 1 | Image 2 |
 |
 |
| Image 3 | Image 4 |
 |
 |