Transient SSS120412:094055-344341
RA           Dec (2000)
145.22814      -34.72804
Rough Mag:
18.8
Discovery data
Current lightcurve
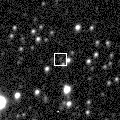
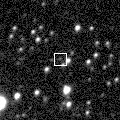
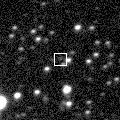
Pre and post-discovery SSS images
SDSS data
Images from other surveys
P60 Follow-up
Pre-discovery 3.6' Siding Spring Survey coadd image (transient location marked with 0)
N is towards the top and E is to the left.
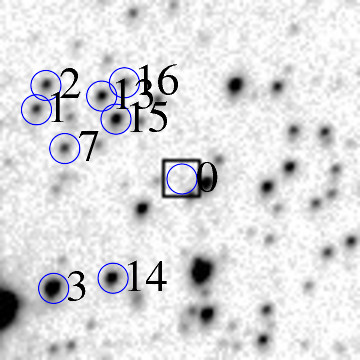
ID    RA         Dec (2000)      mag      delmag    delra (")    deldec (")  PA (deg)

0    145.22814     -34.72804      18.8     0.0        0.0         0.0       0.0
1    145.25773     -34.71646      17.5    -1.3       87.5        41.7      64.5
2    145.25576     -34.71243      17.4    -1.4       81.7        56.2      55.5
3    145.25472     -34.74621      15.0    -3.8       78.6       -65.4     129.8
7    145.25211     -34.72297      17.7    -1.1       70.9        18.3      75.6
13    145.24449     -34.71432      17.1    -1.7       48.4        49.4      44.4
14    145.24266     -34.74465      16.1    -2.6       43.0       -59.8     144.3
15    145.24166     -34.71819      16.6    -2.1       40.0        35.5      48.4
16    145.23986     -34.71216      17.9    -0.8       34.7        57.2      31.2
18    145.23765     -34.74800      17.9    -0.9       28.1       -71.9     158.6
20    145.23647     -34.73313      16.4    -2.3       24.6       -18.3     126.6
25    145.22653     -34.73092      17.7    -1.1       -4.8       -10.4     204.7
26    145.22452     -34.74356      14.1    -4.6      -10.7       -55.9     190.9
27    145.22345     -34.72894      16.1    -2.7      -13.9        -3.2     256.9
28    145.22376     -34.75066      15.6    -3.1      -13.0       -81.4     189.0
29    145.22110     -34.72522      17.9    -0.8      -20.8        10.2     296.0
30    145.21738     -34.71267      15.7    -3.1      -31.8        55.3     330.1
33    145.21109     -34.72960      16.7    -2.0      -50.4        -5.6     263.6
34    145.21128     -34.75005      17.6    -1.1      -49.9       -79.2     212.2
36    145.20897     -34.71298      17.3    -1.5      -56.7        54.2     313.7
38    145.20662     -34.72637      16.9    -1.8      -63.7         6.0     275.4
39    145.20565     -34.72035      17.6    -1.1      -66.5        27.7     292.6
41    145.20106     -34.73238      17.9    -0.8      -80.1       -15.6     259.0
42    145.19930     -34.72079      17.4    -1.3      -85.3        26.1     287.0
43    145.19899     -34.74053      17.9    -0.9      -86.2       -45.0     242.5
| Image 1 | Image 2 |
 |
 |
| Image 3 | Image 4 |
 |
 |