Transient SSS120527:122341-481238
RA           Dec (2000)
185.92033      -48.21067
Rough Mag:
12.4
Discovery data
Current lightcurve
Pre and post-discovery SSS images
SDSS data
Images from other surveys
P60 Follow-up
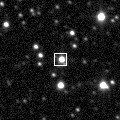
Pre-discovery 3.6' Siding Spring Survey coadd image (transient location marked with 0)
N is towards the top and E is to the left.
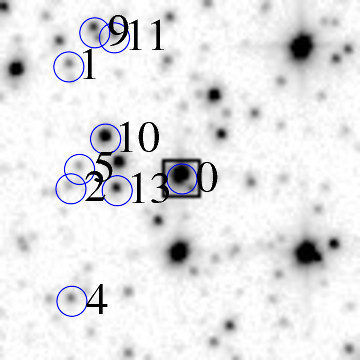
ID    RA         Dec (2000)      mag      delmag    delra (")    deldec (")  PA (deg)

0    185.92033     -48.21067      12.4     0.0        0.0         0.0       0.0
1    185.94926     -48.19246      17.2     4.8       69.4        65.6      46.6
2    185.94842     -48.21275      17.9     5.5       67.4        -7.5      96.3
4    185.94788     -48.23147      17.1     4.7       66.1       -74.9     138.6
5    185.94632     -48.20950      17.8     5.5       62.4         4.2      86.1
9    185.94286     -48.18674      15.9     3.5       54.0        86.1      32.1
10    185.93989     -48.20441      14.5     2.1       46.9        22.5      64.3
11    185.93796     -48.18755      17.2     4.9       42.3        83.2      26.9
13    185.93686     -48.21299      15.8     3.4       39.7        -8.4     101.9
14    185.93635     -48.20867      14.5     2.1       38.4         7.2      79.4
16    185.93344     -48.23037      17.5     5.1       31.5       -70.9     156.1
19    185.92629     -48.21838      15.9     3.5       14.3       -27.8     152.7
21    185.92472     -48.19177      17.1     4.7       10.5        68.0       8.8
23    185.92089     -48.22355      12.4    -0.0        1.3       -46.4     178.3
27    185.91715     -48.22657      17.6     5.2       -7.6       -57.2     187.6
31    185.91288     -48.19735      14.4     2.0      -17.9        48.0     339.6
34    185.91181     -48.22457      17.6     5.3      -20.4       -50.0     202.2
35    185.91102     -48.20376      15.6     3.3      -22.3        24.9     318.1
36    185.90976     -48.20028      17.9     5.6      -25.4        37.4     325.9
38    185.90697     -48.22325      17.7     5.3      -32.1       -45.3     215.3
40    185.90315     -48.21169      17.1     4.7      -41.2        -3.7     264.9
41    185.90260     -48.20030      17.0     4.6      -42.5        37.3     311.3
43    185.89856     -48.22230      17.6     5.2      -52.2       -41.9     231.3
45    185.89581     -48.22694      17.4     5.0      -58.8       -58.6     225.1
47    185.89592     -48.19479      17.1     4.7      -58.6        57.2     314.3
51    185.89093     -48.18908      11.4    -1.0      -70.5        77.7     317.8
| Image 1 | Image 2 |
 |
 |
| Image 3 | Image 4 |
 |
 |