Transient SSS120530:111636-440750
RA           Dec (2000)
169.15003      -44.13058
Rough Mag:
12.7
Discovery data
Current lightcurve
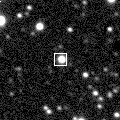
Pre and post-discovery SSS images
SDSS data
Images from other surveys
P60 Follow-up
Pre-discovery 3.6' Siding Spring Survey coadd image (transient location marked with 0)
N is towards the top and E is to the left.
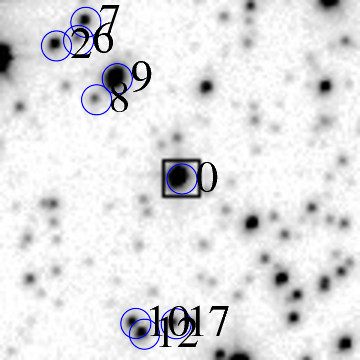
ID    RA         Dec (2000)      mag      delmag    delra (")    deldec (")  PA (deg)

0    169.15003     -44.13058      12.7     0.0        0.0         0.0       0.0
2    169.17977     -44.10886      15.6     2.9       76.8        78.2      44.5
6    169.17467     -44.10792      17.4     4.7       63.7        81.6      38.0
8    169.17036     -44.11777      17.2     4.5       52.5        46.1      48.7
9    169.16561     -44.11422      13.0     0.4       40.3        58.9      34.4
10    169.16078     -44.15495      16.3     3.6       27.8       -87.7     162.4
17    169.15142     -44.15495      16.6     3.9        3.6       -87.7     177.7
18    169.15106     -44.12424      17.5     4.9        2.7        22.8       6.7
19    169.14671     -44.15478      17.9     5.2       -8.6       -87.1     185.6
22    169.14457     -44.11568      15.7     3.0      -14.1        53.6     345.3
23    169.14402     -44.13309      18.0     5.3      -15.5        -9.0     239.8
29    169.13523     -44.10800      17.8     5.1      -38.2        81.3     334.8
33    169.13341     -44.13826      15.1     2.4      -42.9       -27.6     237.2
34    169.13326     -44.12111      17.6     4.9      -43.3        34.1     308.2
35    169.13019     -44.14421      17.3     4.7      -51.3       -49.1     226.3
37    169.12638     -44.14735      15.2     2.6      -61.1       -60.4     225.3
38    169.12570     -44.14011      17.4     4.7      -62.9       -34.3     241.4
39    169.12339     -44.15387      16.1     3.4      -68.8       -83.8     219.4
40    169.12269     -44.15012      16.2     3.5      -70.6       -70.3     225.1
| Image 1 | Image 2 |
 |
 |
| Image 3 | Image 4 |
 |
 |