Transient SSS120731:133757-175428
RA           Dec (2000)
204.48853      -17.90777
Rough Mag:
14.9
Discovery data
Current lightcurve
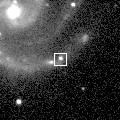
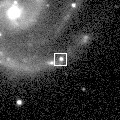
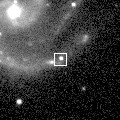
Pre and post-discovery SSS images
SDSS data
Images from other surveys
P60 Follow-up
Pre-discovery 3.6' Siding Spring Survey coadd image (transient location marked with 0)
N is towards the top and E is to the left.
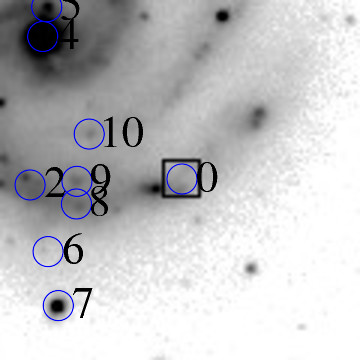
ID    RA         Dec (2000)      mag      delmag    delra (")    deldec (")  PA (deg)

0    204.48853     -17.90777      14.9     0.0        0.0         0.0       0.0
4    204.51295     -17.88409      12.2    -2.7       83.7        85.2      44.5
6    204.51234     -17.91991      16.8     1.9       81.6       -43.7     118.2
7    204.51063     -17.92891      15.0     0.1       75.7       -76.1     135.2
8    204.50730     -17.91202      15.3     0.4       64.3       -15.3     103.4
9    204.50718     -17.90826      15.3     0.4       63.9        -1.8      91.6
10    204.50497     -17.90040      17.0     2.1       56.3        26.5      64.8
11    204.50460     -17.88789      16.9     2.0       55.0        71.6      37.6
13    204.50373     -17.90706      17.8     2.9       52.1         2.6      87.2
14    204.50309     -17.88515      16.0     1.1       49.9        81.4      31.5
15    204.50296     -17.90253      17.4     2.5       49.4        18.9      69.1
17    204.50038     -17.90542      18.0     3.1       40.6         8.5      78.2
18    204.50027     -17.91225      16.2     1.3       40.2       -16.1     111.9
19    204.49774     -17.89866      16.4     1.5       31.5        32.8      43.9
20    204.49638     -17.90359      16.1     1.2       26.9        15.0      60.8
22    204.49387     -17.90946      14.4    -0.5       18.3        -6.1     108.4
24    204.48958     -17.89377      18.0     3.1        3.6        50.4       4.1
25    204.48898     -17.89201      17.9     3.0        1.5        56.7       1.6
26    204.48519     -17.88648      16.4     1.5      -11.4        76.6     351.5
27    204.48417     -17.90376      17.9     3.1      -14.9        14.4     314.0
29    204.47669     -17.89792      14.4    -0.5      -40.6        35.5     311.2
30    204.47672     -17.92278      17.6     2.7      -40.5       -54.0     216.8
| Image 1 | Image 2 |
 |
 |
| Image 3 | Image 4 |
 |
 |