Transient SSS120906:195112-212848
RA           Dec (2000)
297.80038      -21.47988
Rough Mag:
18.1
Discovery data
Current lightcurve
Pre and post-discovery SSS images
SDSS data
Images from other surveys
P60 Follow-up
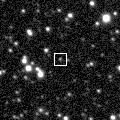
Pre-discovery 3.6' Siding Spring Survey coadd image (transient location marked with 0)
N is towards the top and E is to the left.
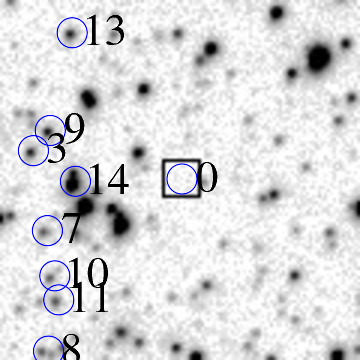
ID    RA         Dec (2000)      mag      delmag    delra (")    deldec (")  PA (deg)

0    297.80038     -21.47988      18.1     0.0        0.0         0.0       0.0
3    297.82716     -21.47510      17.4    -0.7       89.7        17.2      79.1
7    297.82483     -21.48844      18.0    -0.1       81.9       -30.8     110.6
9    297.82411     -21.47178      17.2    -0.9       79.5        29.2      69.9
10    297.82361     -21.49599      18.0    -0.2       77.8       -58.0     126.7
11    297.82295     -21.49999      17.8    -0.3       75.6       -72.4     133.8
13    297.81998     -21.45557      17.4    -0.7       65.7        87.5      36.9
14    297.81971     -21.48029      15.1    -3.0       64.8        -1.5      91.3
16    297.81896     -21.48888      17.6    -0.5       62.2       -32.4     117.5
17    297.81765     -21.48411      14.4    -3.8       57.9       -15.2     104.7
18    297.81671     -21.46638      15.5    -2.6       54.7        48.6      48.4
19    297.81547     -21.48172      17.5    -0.6       50.6        -6.6      97.5
23    297.81283     -21.48463      16.4    -1.7       41.7       -17.1     112.3
27    297.81122     -21.48724      14.4    -3.7       36.3       -26.5     126.1
30    297.80793     -21.47534      16.5    -1.6       25.3        16.3      57.1
33    297.80687     -21.46472      16.5    -1.6       21.7        54.6      21.7
38    297.80066     -21.45545      17.7    -0.5        0.9        87.9       0.6
43    297.79659     -21.45982      17.7    -0.4      -12.7        72.2     350.0
46    297.79574     -21.49750      17.7    -0.4      -15.5       -63.4     193.8
47    297.79482     -21.45802      15.8    -2.3      -18.6        78.7     346.7
54    297.78418     -21.48258      16.8    -1.3      -54.3        -9.7     259.8
57    297.78030     -21.46229      16.8    -1.3      -67.3        63.3     313.3
58    297.78000     -21.49593      17.5    -0.6      -68.3       -57.8     229.8
62    297.77558     -21.45961      13.2    -4.9      -83.1        73.0     311.3
63    297.77370     -21.48921      17.8    -0.3      -89.4       -33.6     249.4
| Image 1 | Image 2 |
 |
 |
| Image 3 | Image 4 |
 |
 |