Transient SSS130311:111518-452917
RA           Dec (2000)
168.82505      -45.48801
Rough Mag:
17.9
Discovery data
Current lightcurve
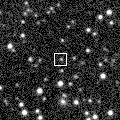
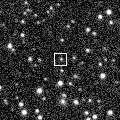
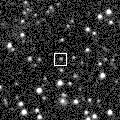
Pre and post-discovery SSS images
SDSS data
Images from other surveys
P60 Follow-up
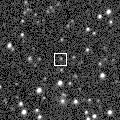
Pre-discovery 3.6' Siding Spring Survey coadd image (transient location marked with 0)
N is towards the top and E is to the left.
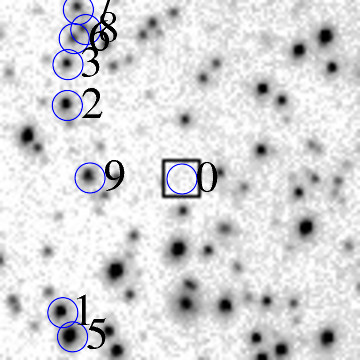
ID    RA         Dec (2000)      mag      delmag    delra (")    deldec (")  PA (deg)

0    168.82505     -45.48801      17.9     0.0        0.0         0.0       0.0
1    168.85339     -45.51071      16.4    -1.5       71.5       -81.7     138.8
2    168.85281     -45.47620      17.0    -0.9       70.1        42.5      58.7
3    168.85275     -45.46939      17.5    -0.4       69.9        67.0      46.2
6    168.85133     -45.46505      17.9    -0.0       66.3        82.7      38.7
8    168.84859     -45.46353      17.6    -0.3       59.4        88.1      34.0
9    168.84724     -45.48823      17.0    -1.0       56.0        -0.8      90.8
15    168.84039     -45.50381      15.3    -2.6       38.7       -56.9     145.8
20    168.83701     -45.50761      18.0     0.1       30.2       -70.6     156.8
22    168.83479     -45.46440      17.8    -0.2       24.6        85.0      16.1
26    168.82562     -45.50012      15.5    -2.4        1.4       -43.6     178.1
27    168.82487     -45.49362      17.6    -0.3       -0.5       -20.2     181.3
28    168.82461     -45.47842      17.8    -0.1       -1.1        34.5     358.2
29    168.82361     -45.50912      16.1    -1.8       -3.6       -76.0     182.7
30    168.82280     -45.50605      17.4    -0.5       -5.7       -64.9     185.0
31    168.82024     -45.47140      17.8    -0.1      -12.1        59.8     348.5
32    168.81839     -45.50029      17.6    -0.3      -16.8       -44.2     200.8
35    168.81464     -45.49666      17.8    -0.1      -26.3       -31.1     220.2
36    168.81430     -45.50937      16.2    -1.7      -27.1       -76.9     199.4
43    168.80603     -45.48344      16.9    -1.0      -48.0        16.5     288.9
44    168.80614     -45.47315      16.7    -1.2      -47.7        53.5     318.3
45    168.80444     -45.50860      17.5    -0.4      -52.0       -74.1     215.1
46    168.80157     -45.47507      17.5    -0.4      -59.3        46.6     308.2
49    168.79769     -45.46667      16.4    -1.5      -69.1        76.8     318.0
51    168.79718     -45.49031      17.4    -0.5      -70.3        -8.3     263.3
52    168.79535     -45.49614      15.6    -2.3      -75.0       -29.3     248.7
| Image 1 | Image 2 |
 |
 |
| Image 3 | Image 4 |
 |
 |