Transient SSS130317:142756-420619
RA           Dec (2000)
216.98458      -42.10537
Rough Mag:
14.4
Discovery data
Current lightcurve
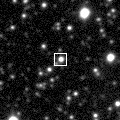
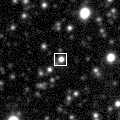
Pre and post-discovery SSS images
SDSS data
Images from other surveys
P60 Follow-up
Pre-discovery 3.6' Siding Spring Survey coadd image (transient location marked with 0)
N is towards the top and E is to the left.
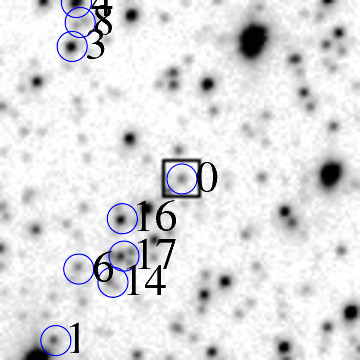
ID    RA         Dec (2000)      mag      delmag    delra (")    deldec (")  PA (deg)

0    216.98458     -42.10537      14.4     0.0        0.0         0.0       0.0
3    217.00934     -42.08339      16.2     1.7       66.1        79.1      39.9
6    217.00824     -42.12047      17.8     3.4       63.2       -54.4     130.7
14    217.00058     -42.12272      17.6     3.1       42.7       -62.5     145.6
16    216.99838     -42.11215      16.4     1.9       36.9       -24.4     123.5
17    216.99808     -42.11837      16.1     1.6       36.1       -46.8     142.4
18    216.99626     -42.09879      16.1     1.7       31.2        23.7      52.8
22    216.99254     -42.11048      15.5     1.1       21.3       -18.4     130.9
24    216.99076     -42.11565      16.9     2.5       16.5       -37.0     156.0
27    216.98766     -42.10731      17.8     3.3        8.2        -7.0     130.3
30    216.98647     -42.08780      17.1     2.7        5.0        63.3       4.6
31    216.98646     -42.08971      17.2     2.7        5.0        56.4       5.1
32    216.98570     -42.13017      17.4     3.0        3.0       -89.3     178.1
33    216.98535     -42.10076      17.8     3.4        2.1        16.6       7.1
38    216.97973     -42.12511      16.2     1.8      -13.0       -71.1     190.3
40    216.97876     -42.08970      15.7     1.3      -15.5        56.4     344.6
44    216.97494     -42.12261      16.1     1.6      -25.7       -62.1     202.5
46    216.96998     -42.11467      18.0     3.5      -39.0       -33.5     229.4
49    216.96844     -42.08226      11.5    -2.9      -43.1        83.2     332.6
52    216.96665     -42.10518      17.9     3.5      -47.9         0.7     270.8
56    216.96094     -42.11163      15.7     1.2      -63.1       -22.5     250.4
57    216.95909     -42.08573      16.4     2.0      -68.1        70.7     316.1
59    216.95714     -42.09111      16.9     2.5      -73.3        51.3     305.0
62    216.95586     -42.09348      17.9     3.4      -76.7        42.8     299.2
| Image 1 | Image 2 |
 |
 |
| Image 3 | Image 4 |
 |
 |