Transient SSS130414:064103-134422
RA           Dec (2000)
100.26244      -13.73946
Rough Mag:
16.5
Discovery data
Current lightcurve
Pre and post-discovery SSS images
SDSS data
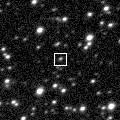
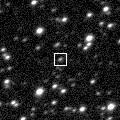
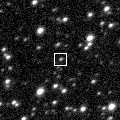
Images from other surveys
P60 Follow-up
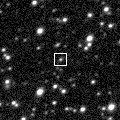
Pre-discovery 3.6' Siding Spring Survey coadd image (transient location marked with 0)
N is towards the top and E is to the left.
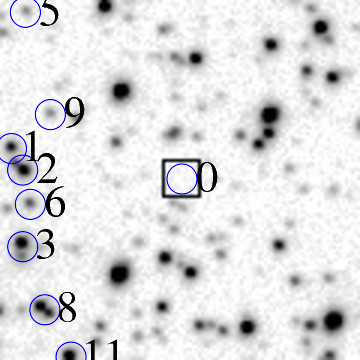
ID    RA         Dec (2000)      mag      delmag    delra (")    deldec (")  PA (deg)

0    100.26244     -13.73946      16.5     0.0        0.0         0.0       0.0
8    100.28642     -13.76126      15.1    -1.4       83.9       -78.5     133.1
9    100.28515     -13.72877      17.8     1.3       79.4        38.5      64.1
13    100.28062     -13.72946      17.5     0.9       63.6        36.0      60.5
15    100.27660     -13.76423      17.3     0.8       49.5       -89.2     151.0
18    100.27384     -13.73356      16.9     0.4       39.9        21.2      62.0
20    100.27341     -13.75551      13.3    -3.2       38.4       -57.8     146.4
21    100.27304     -13.72504      13.9    -2.6       37.1        51.9      35.5
29    100.26560     -13.71485      17.5     0.9       11.1        88.6       7.1
30    100.26604     -13.76104      16.1    -0.4       12.6       -77.7     170.8
32    100.26552     -13.75284      15.5    -1.1       10.8       -48.2     167.4
33    100.26408     -13.73211      16.5    -0.1        5.7        26.5      12.2
38    100.26342     -13.71962      16.9     0.4        3.4        71.4       2.7
40    100.26129     -13.75522      15.4    -1.1       -4.0       -56.7     184.1
41    100.26023     -13.71962      15.3    -1.2       -7.7        71.4     353.8
44    100.25921     -13.76410      16.3    -0.3      -11.3       -88.7     187.3
45    100.25721     -13.74958      17.6     1.1      -18.3       -36.4     206.7
47    100.25601     -13.75229      17.6     1.1      -22.5       -46.2     206.0
50    100.25257     -13.73244      16.9     0.3      -34.5        25.3     306.2
51    100.25146     -13.76445      14.7    -1.8      -38.4       -90.0     203.1
52    100.24941     -13.73395      15.9    -0.7      -45.6        19.8     293.5
53    100.24775     -13.73206      15.6    -0.9      -51.4        26.6     297.4
54    100.24757     -13.72906      13.7    -2.9      -52.0        37.4     305.8
55    100.24733     -13.71747      15.4    -1.1      -52.8        79.2     326.3
56    100.24599     -13.75080      16.1    -0.4      -57.5       -40.8     234.6
59    100.24320     -13.75675      17.2     0.6      -67.3       -62.2     227.2
64    100.24116     -13.72183      16.5    -0.1      -74.4        63.5     310.5
67    100.24063     -13.76418      16.3    -0.2      -76.3       -89.0     220.6
69    100.23873     -13.71470      14.6    -1.9      -82.9        89.1     317.1
71    100.23744     -13.75636      17.8     1.2      -87.4       -60.8     235.2
74    100.23678     -13.76342      13.3    -3.2      -89.7       -86.3     226.1
| Image 1 | Image 2 |
 |
 |
| Image 3 | Image 4 |
 |
 |