Transient SSS130621:191833-521451
RA           Dec (2000)
289.63564      -52.24745
Rough Mag:
17.9
Discovery data
Current lightcurve
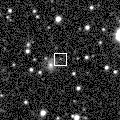
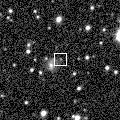
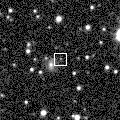
Pre and post-discovery SSS images
SDSS data
Images from other surveys
P60 Follow-up
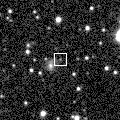
Pre-discovery 3.6' Siding Spring Survey coadd image (transient location marked with 0)
N is towards the top and E is to the left.
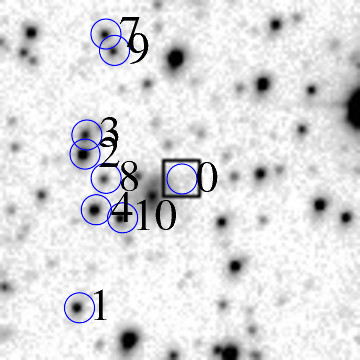
ID    RA         Dec (2000)      mag      delmag    delra (")    deldec (")  PA (deg)

0    289.63564     -52.24745      17.9     0.0        0.0         0.0       0.0
1    289.66442     -52.26889      16.6    -1.3       63.4       -77.2     140.6
2    289.66232     -52.24331      15.7    -2.2       58.8        14.9      75.8
3    289.66173     -52.24013      16.8    -1.2       57.5        26.4      65.4
4    289.65948     -52.25260      16.2    -1.7       52.5       -18.5     109.4
7    289.65616     -52.22337      17.0    -0.9       45.2        86.7      27.6
8    289.65668     -52.24739      17.6    -0.3       46.4         0.2      89.7
9    289.65389     -52.22612      17.2    -0.7       40.2        76.8      27.6
10    289.65234     -52.25402      16.7    -1.2       36.8       -23.7     122.7
13    289.64752     -52.24702      17.6    -0.3       26.2         1.5      86.6
14    289.64463     -52.23164      17.9    -0.1       19.8        56.9      19.2
15    289.64346     -52.25018      15.1    -2.8       17.2        -9.8     119.7
20    289.63693     -52.22747      14.1    -3.8        2.8        71.9       2.3
22    289.62478     -52.25481      16.7    -1.2      -23.9       -26.5     222.1
25    289.62148     -52.24722      17.8    -0.1      -31.2         0.8     271.5
26    289.62120     -52.26214      15.9    -2.0      -31.8       -52.9     211.0
30    289.61423     -52.24683      16.4    -1.6      -47.2         2.2     272.7
31    289.61331     -52.23194      15.2    -2.7      -49.2        55.8     318.6
| Image 1 | Image 2 |
 |
 |
| Image 3 | Image 4 |
 |
 |