ZTF Data Quailty Home
| Topics |
|---|
| Rapid variations in ZTF flats. |
| ZTF Flatfield Image Examination. |
| Variations in I-band flats over days. |
| Variations in G-band Image Sequences. |
| Variations in G-band images over days. |
| G-band response variations between CCDs. |
| Flatfield variations Discussion. |
Short timescale flatfield variations
A recent update of the ZTF analysis system by R. Walters allows for a comparison of individual ZTF flat field median values over time for each image among the 64 ZTF quadrants. This is a significant improvement since the previous system combined all of these values (LED sequences and quadrants) into a single value per filter.Initial inspection of the flatfield median values led to the discovery of a number of trends and features within the data. Including within sequences of images taken with the same LED, between different quadrants, and between dates.
Variations within an Image Sequence
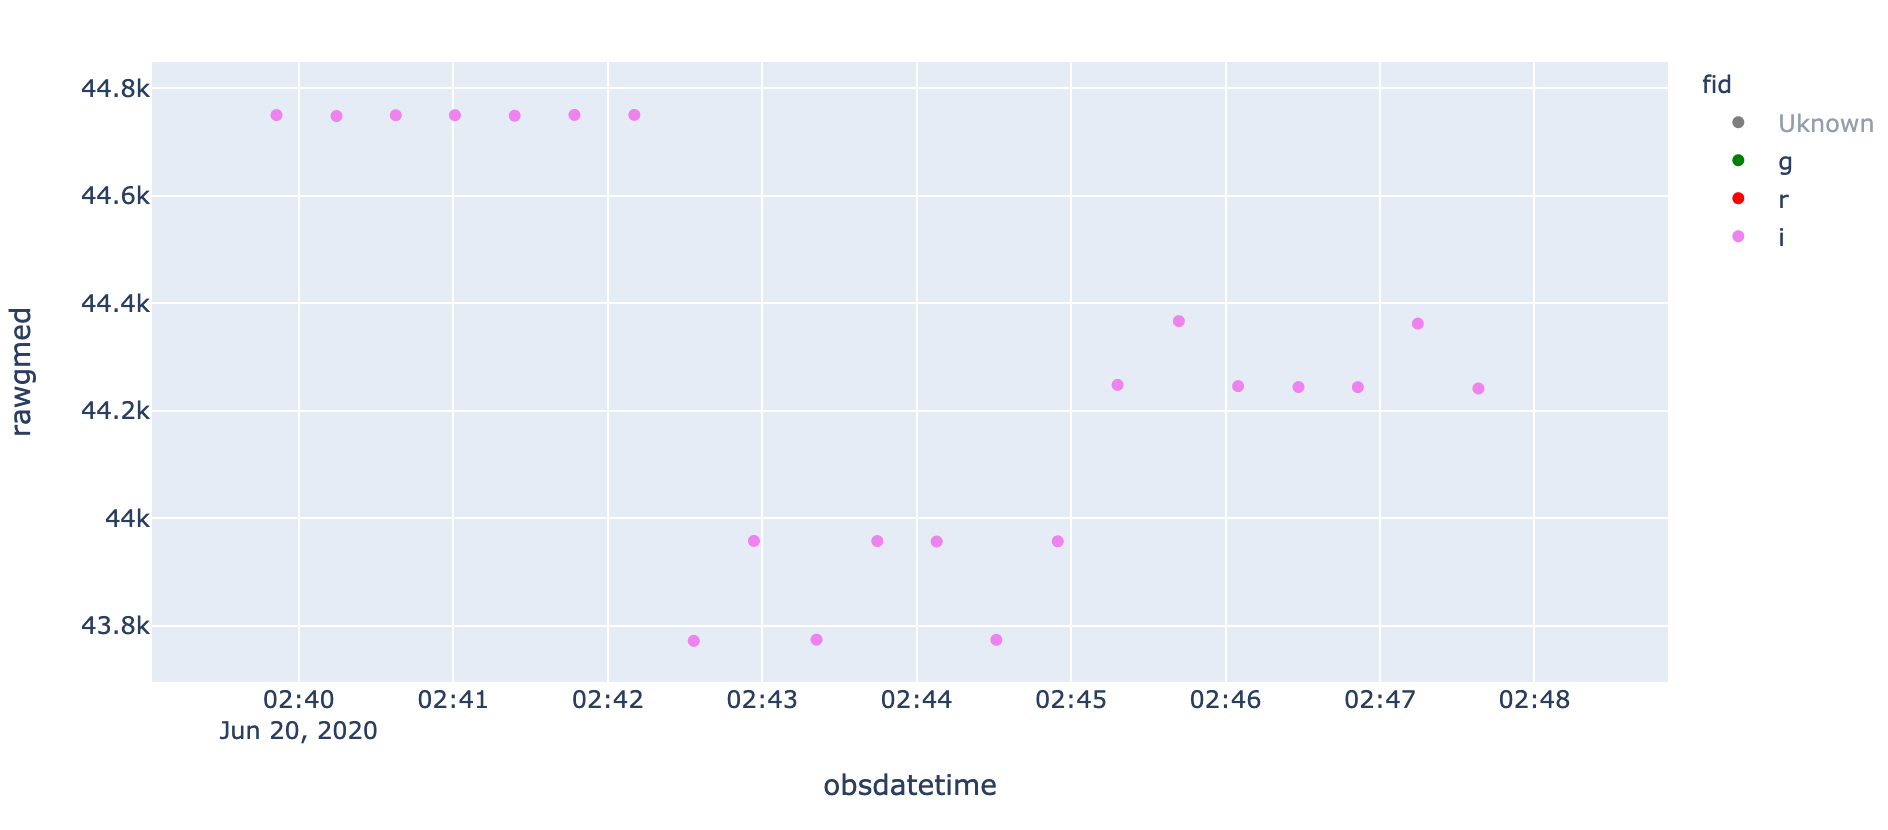
Median i-band flat values for RC00 taken in sequences of seven images with three LEDs (11,12,13) on 2020-06-20.
In the plot above I show the median values for i-band flats taken with three LEDS (seven images each) on 2020-06-20. Here we see that for the first sequence of seven flats with LED 11 there is little variation. However, in the second sequence, with LED 12, the median flatfield values vary between 43.8k counts and 44k counts. The third sequence, with LED 13, varies similarly between the separate images. Although the variations here are only ~0.5%, such changes are unexpected and significant on the < 1% level at we wish to do photometry.
Variations in Response between Readout Channels
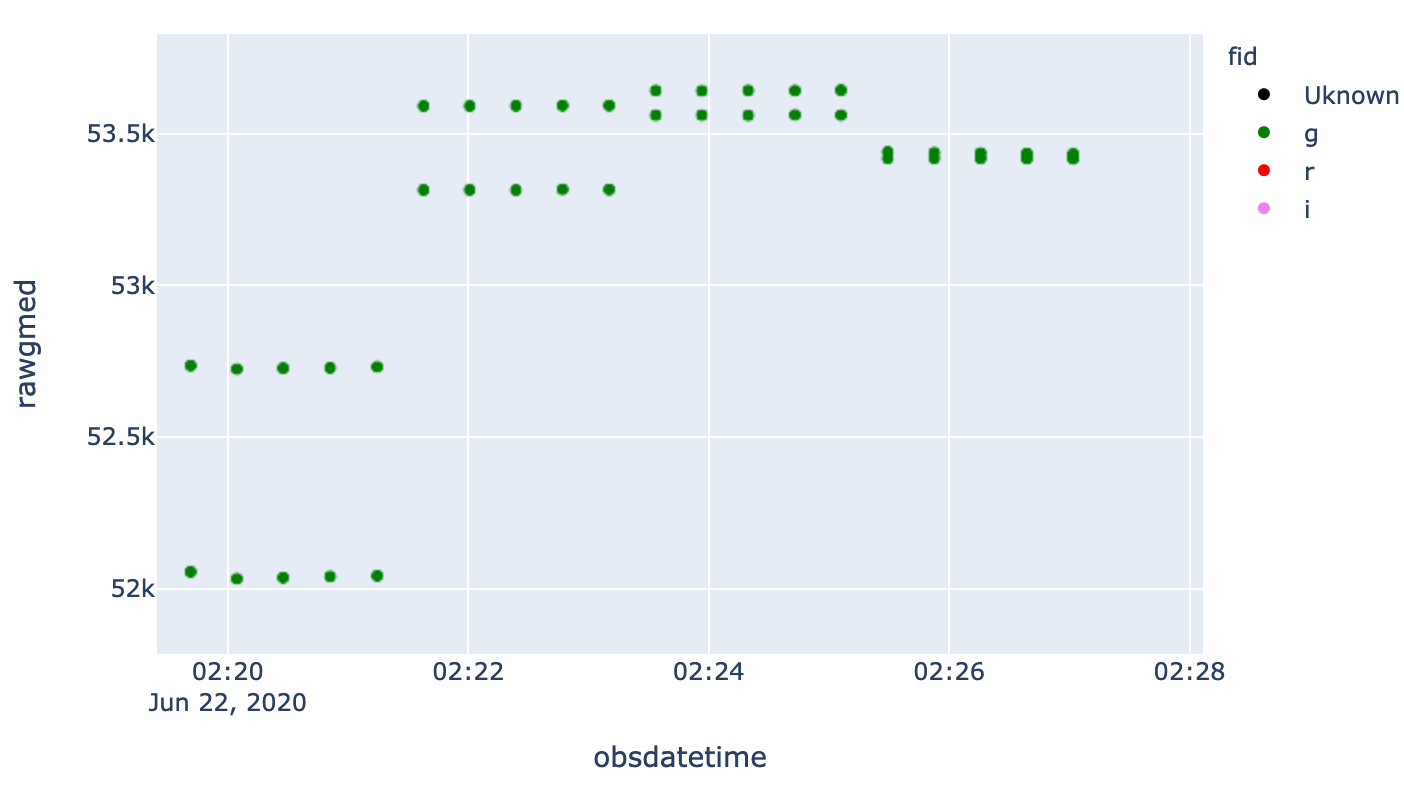
Median g-band flat values for RCs 53 and 56 in sequences of finve images with four LEDs (2,3,4,5) on 2020-06-22. The upper line on dots are from RC 53 while the lower line in RC 56.
In the plot above we see that g-band flatfield median values are more stable than i-band for sequences taken with a single LED. This is also the case for r-band flats. We expect that the levels in each RC will be offset from others due to vignetting and difference in overall response of the CCDs. We also expect that different LEDs will have different baseline levels due to differences in exposure times, etc. However, when we consider the ratio of values in RC 53 to RC 56 from the plot above, we see that this varies from one LED to the next. This suggests that there is a different colour dependence between these two quadrants (the two CCDs are 14 and 15). For the first sequence (taken with LED 2) the five median values are very different between the two quadrants, while for LED 5 the medians are very close.
The variation in the colour response between these two RCs is >1%.
Variations in the ratio between different readout channels are also seen in i-band (aside from the variations due to the AR coating). This is important since it suggests that the CCDs have different sensitivity curves. Variations in g-band response have been previously been noted based on photometry.
Variations in flatfield levels over time
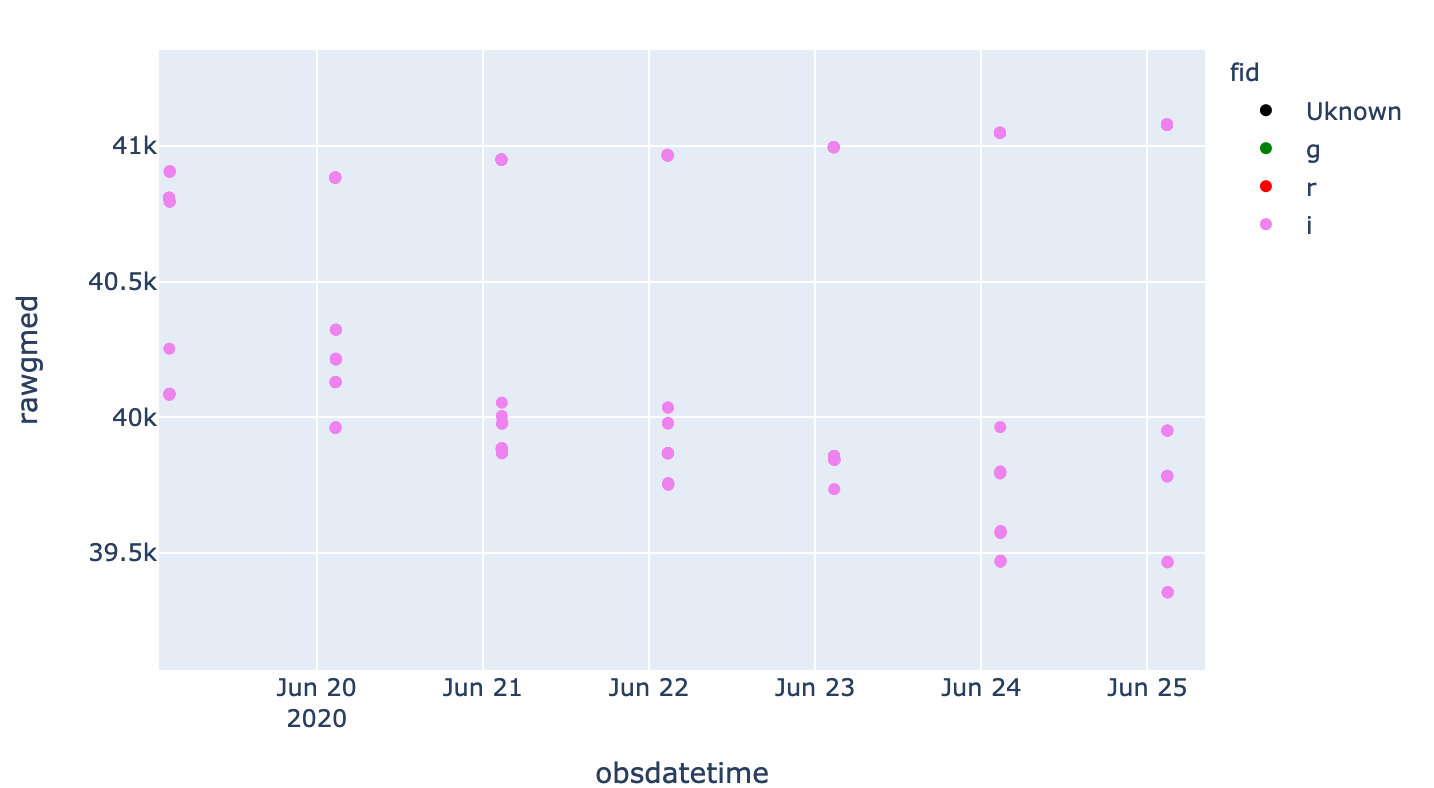
Median values of I-band flat fields for RC 61 and three different LEDs taken between June 20th and June 26th.
In the plot above we see the median values for i-band flats in RC61 over a number of nights. In each case there are three sequences of seven flats with three different LEDs. Here we see that there are significant variations over time. The values from LED 11 getting slightly larger while the values from LEDs 12 and 13 getting significantly smaller. We have previously noted similar instability in the combined I-band flats. Here the observed variation is ~2% over the period of less than a week.
ZTF Flatfield Image Examination
I-band Image Sequences
Since median values can provide little information about how the images vary, we decided to investigate whether the cause of the variations was more obvious within the images.We extracted two nights of nights of raw ZTF flatfield images for g and i-bands. The r-band was not investigated since it appears more stable. We then combined all the quadrant images into the full field image for each individual LED exposure. We then take ratios of matching images so variations can be seen on the same scale.
A combined mosaic image for the entire ZTF camera. The image is the ratio of first and second I-band flatfield images in a sequence with LED 12, taken on June 20th.
In the plot above we see that there are indeed significant variations, even during the span between two images taken in sequence with the same LED. However, the main variations are limited to a small number of CCDs.
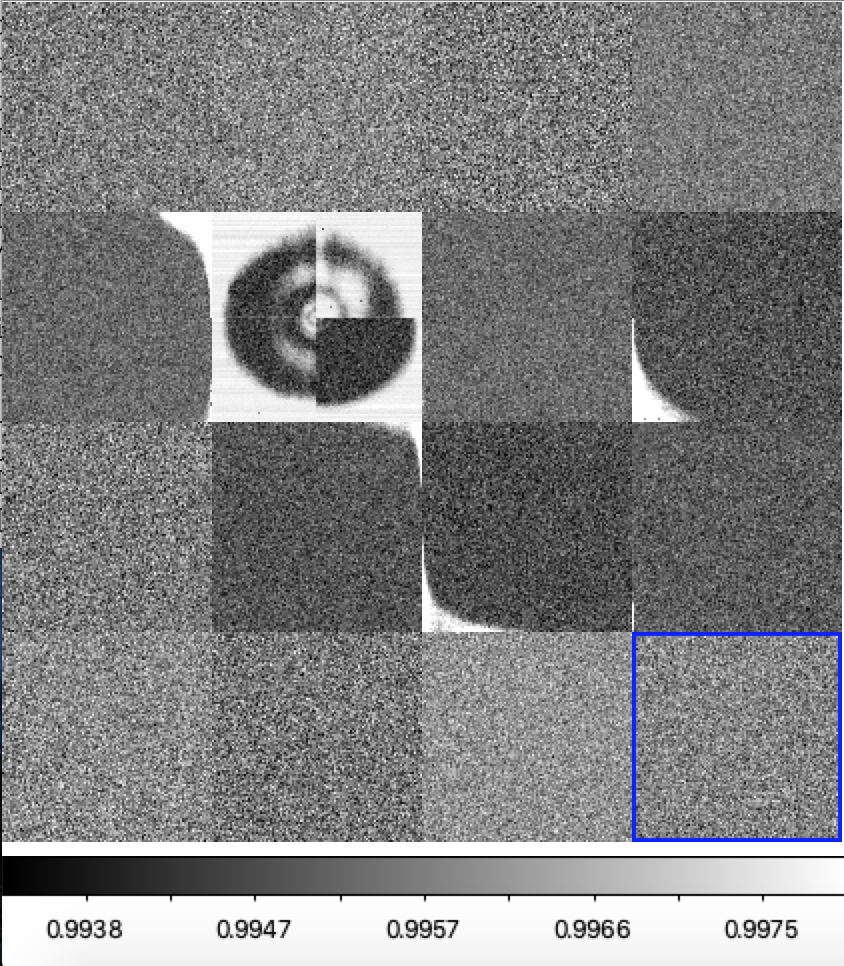
The ratio image for first two frames with LED 12, CCD 11 on 2020-06-20. The right plot is the corresponding histogram for this CCD.
In the plot above we show more detail of the variations seen in CCD 11. The images suggest some level of horizontal structure within the areas with higher counts. The histogram shows a bimodal distribution, with values split between 0.996 (which matches the avage value in most CCDs) and ~1.0 (the expected value given there are no variations). A few of the other CCDs also show similar features on the edges where their values are ~1.0.
A combined mosaic image for the entire ZTF camera. The image is the ratio of first and second I-band flatfield images in a sequence with LED 13, taken on June 20th.
In comparison with the LED 12 results, in the plot above we show the ratio of the first and second images taken with LED 13 on 2020-06-20. This figure shows the same image structure as LED 12. In particular, CCD 11 shows the same bimodal distribution of values.
A combined mosaic image for the entire ZTF camera. The image is the ratio of first and second I-band flatfield images in a sequence with LED 11, taken on June 20th.
As a final comparison of image varitions within an LED sequence in the figure above we show the result for the ratio of the first and second images with the LED 11. In this case no significant variation was noted in the median values. So no structure was expected.
A ratio image for the first and second images taken with LED 11, CCD 11, of 2020-06-20. The right plot is the corresponding histogram for this image.
Nevertheless, when we take a closer look at the ratio image for CCD11 we see similar horizontal line structure around the edges of the image and the histogram has broad wings. The pixel values in the ratio images for the other CCDs are all normally distributed.
Variations in I-band flats over a few days
Since we saw significant variations in the i-band flatfields over the span of ~1 week, we also investigate thest longer timescale variations using the raw flat fields.
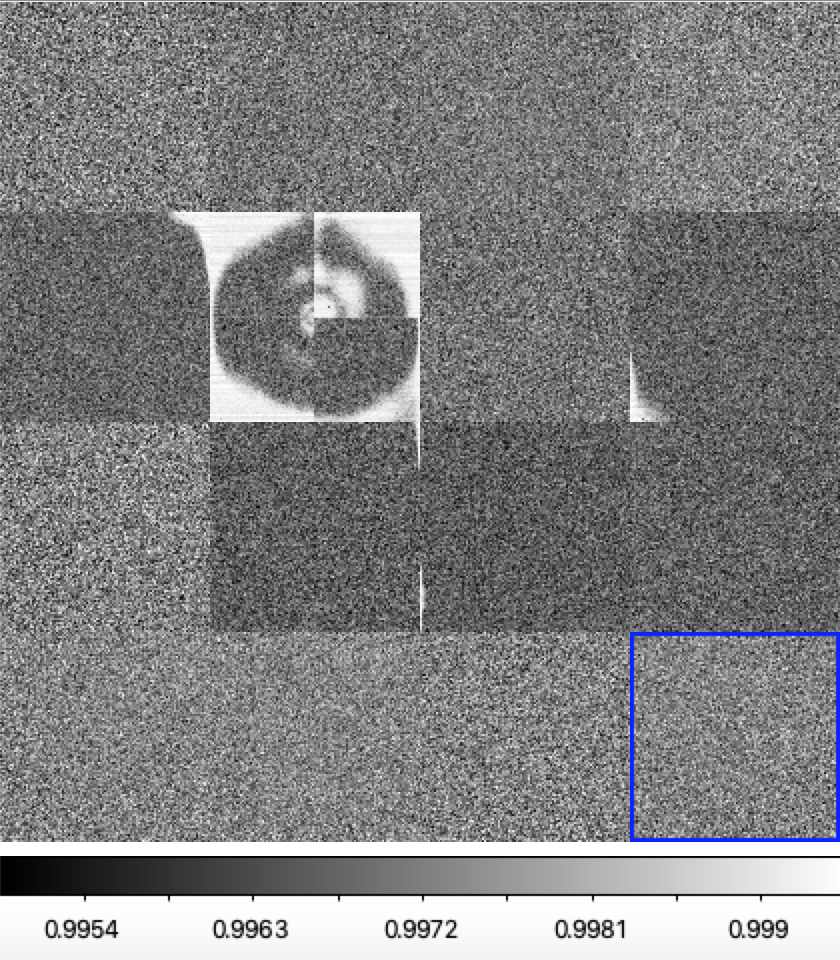
Full mosaic ratio image for LED 13 images taken on 2020-06-20 and 2020-06-26.
In the figure above we show the ratio of the first image taken with LED 13 on 2020-06-20 to the first image taken with LED 13 on 2020-06-26. As with the image sequence comparison above, CCD 11 exhibits significant structure. However, in addition, CCDs 7 and 8 also show strong structure, while CCDs 3 and 4 show weaker structure.
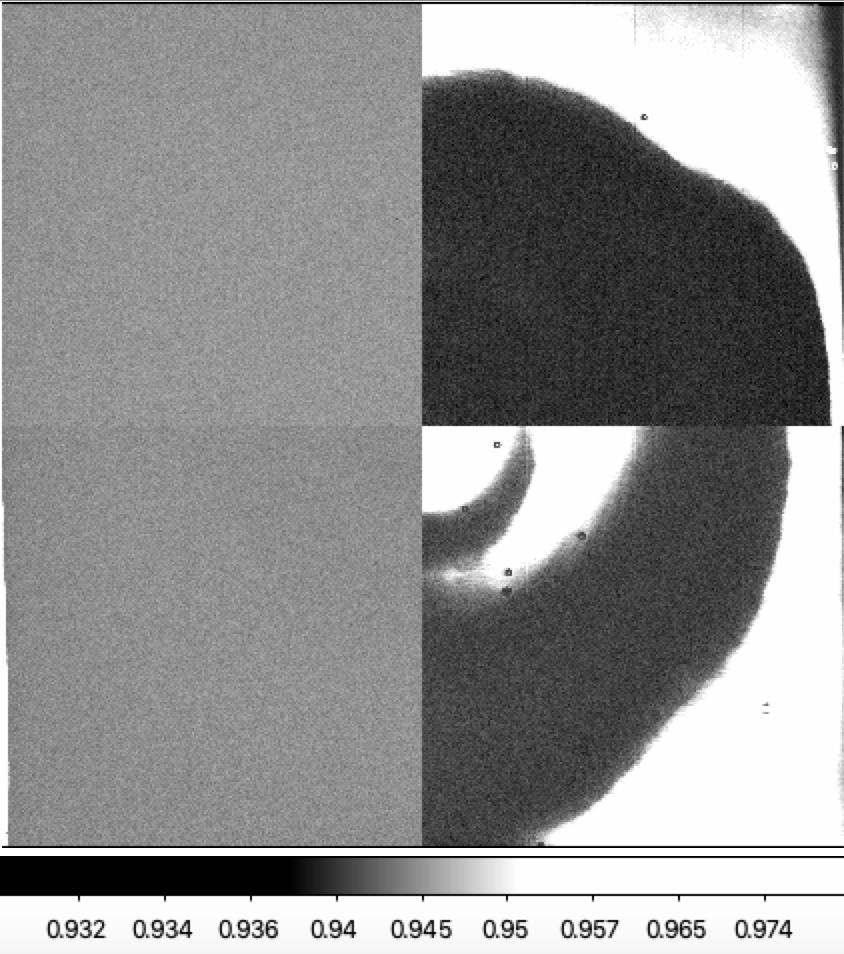
Ratio image for CCDs 7 and 8 taken with LED 13 on 2020-06-20 and 2020-06-26.
In the figure above we show the variations in CCDs 7 and 8 in more detail. The source of this structure is unclea, but appears to be mainly to be limited to CCDs controlled by the same archon (apart from CCD 11).
Full mosaic ratio image for LED 11 images taken on 2020-06-20 and 2020-06-26.
As a comparison to the LED 13 ratio image, above we show the results for the ratio of the first and second images taken with LED 11 on 2020-06-20 and 2020-06-26. In this image we see the same general structure, with most of the variation occuring with the same arcon.
Variations in G-band Image Sequences
Above we have shown that there are large variations in i-band images within a sequence and between days. Now we will compare this to g-band.
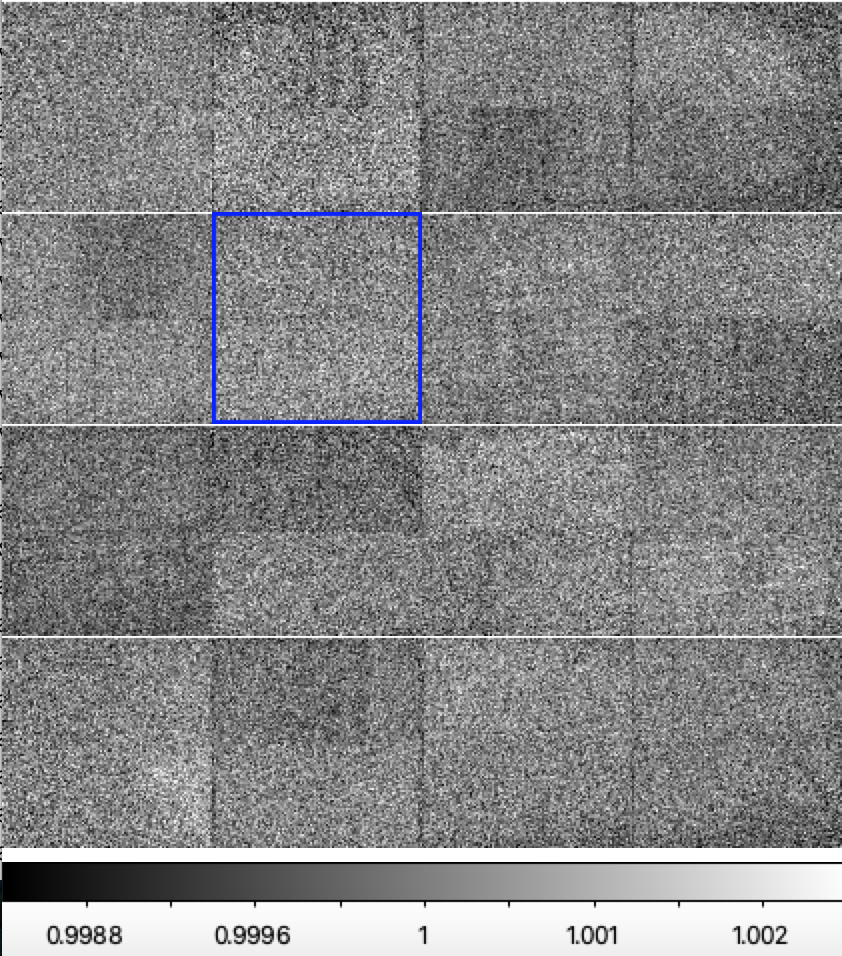
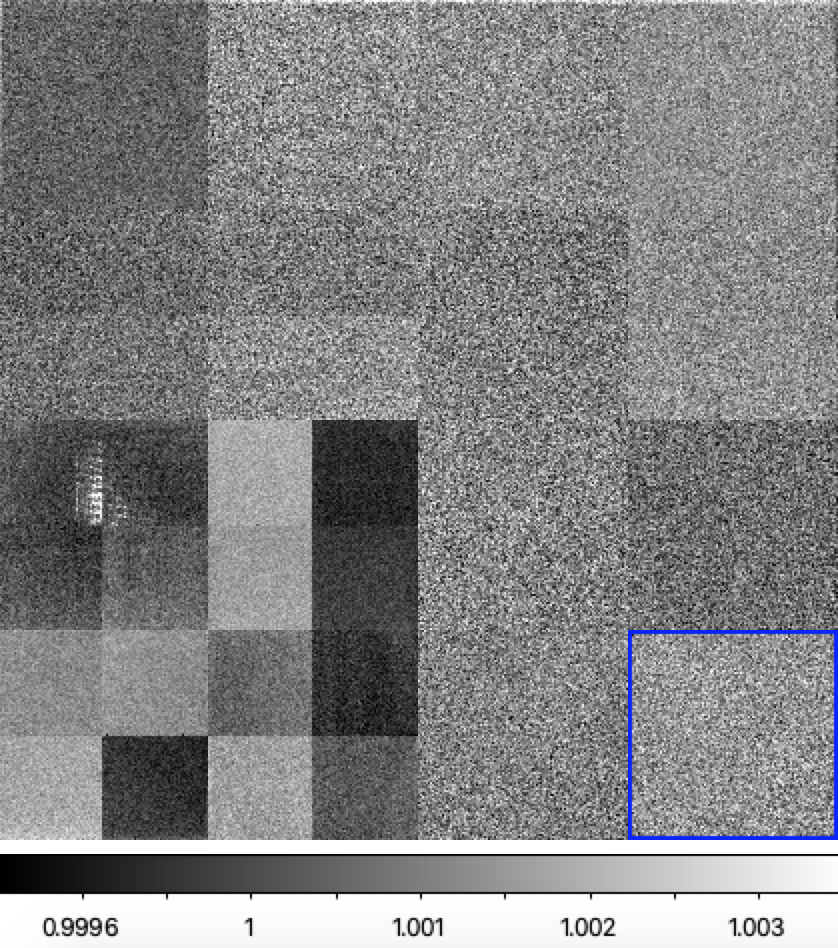
Full mosaic ratio image for the first two images taken with LED 2 on 2020-06-20.
In comparison to the I-band data, above we show the result for the ratio of the first two g-band images taken with LED 2 on 2020-06-20. There is clearly only minor structure in the ratio images.
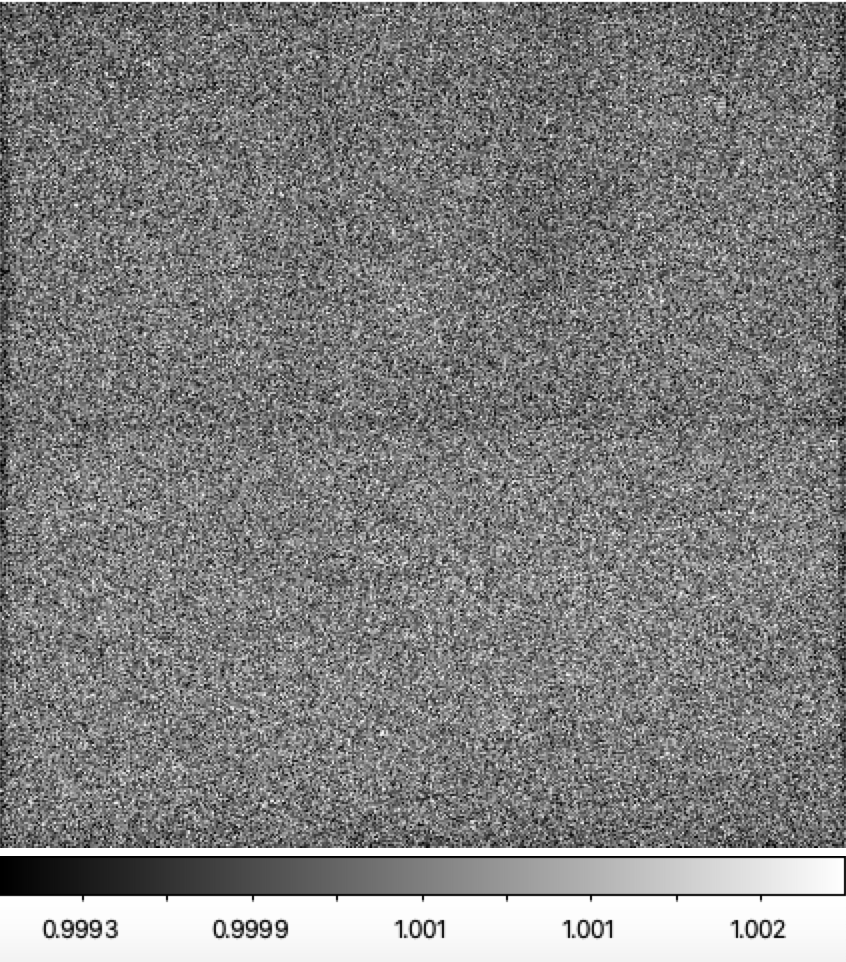
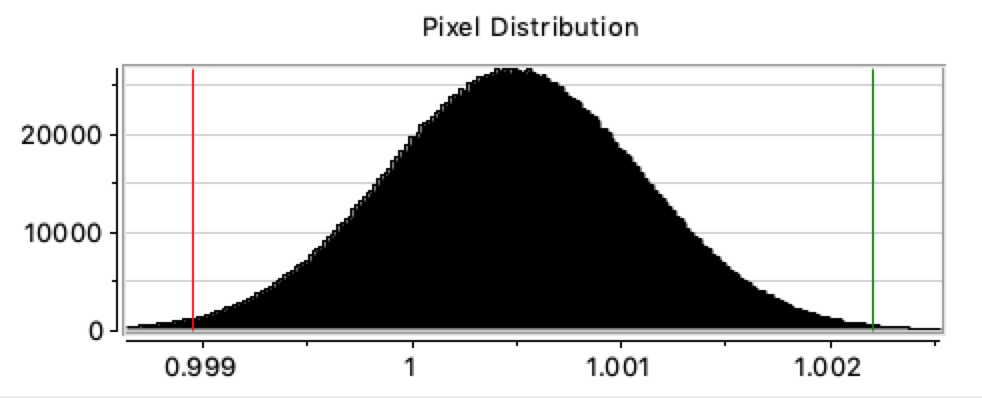
Ratio of the first and second images taken with LED 2 images for CCD 11 on 2020-06-20 (left) along with the corresponding histogram of pixel values (right).
For comparison with the i-band data, we show the ratio for CCD 11 in figure above. Here, unlikely the i-band data there is little evidence of any differences between these two images.
Variations in G-band images over days
In the i-band images we noted significant variations over a period of ~1 week. The g-band the medians values are much more stable. Thus we expect less structure in the images.
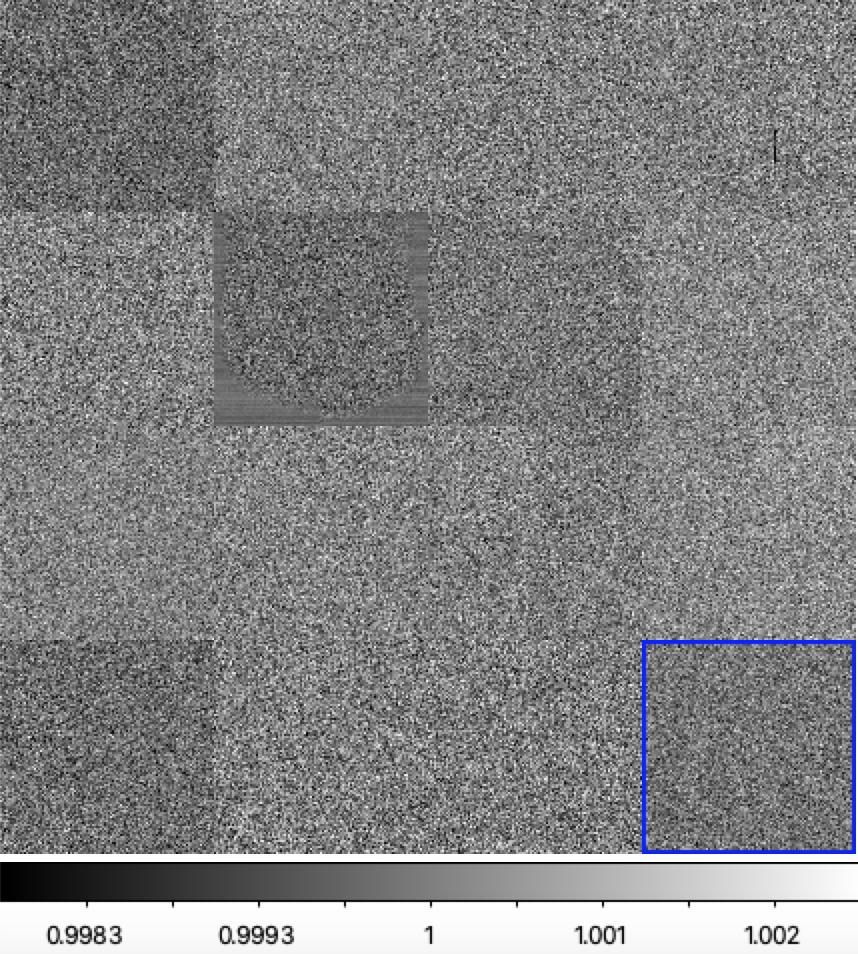
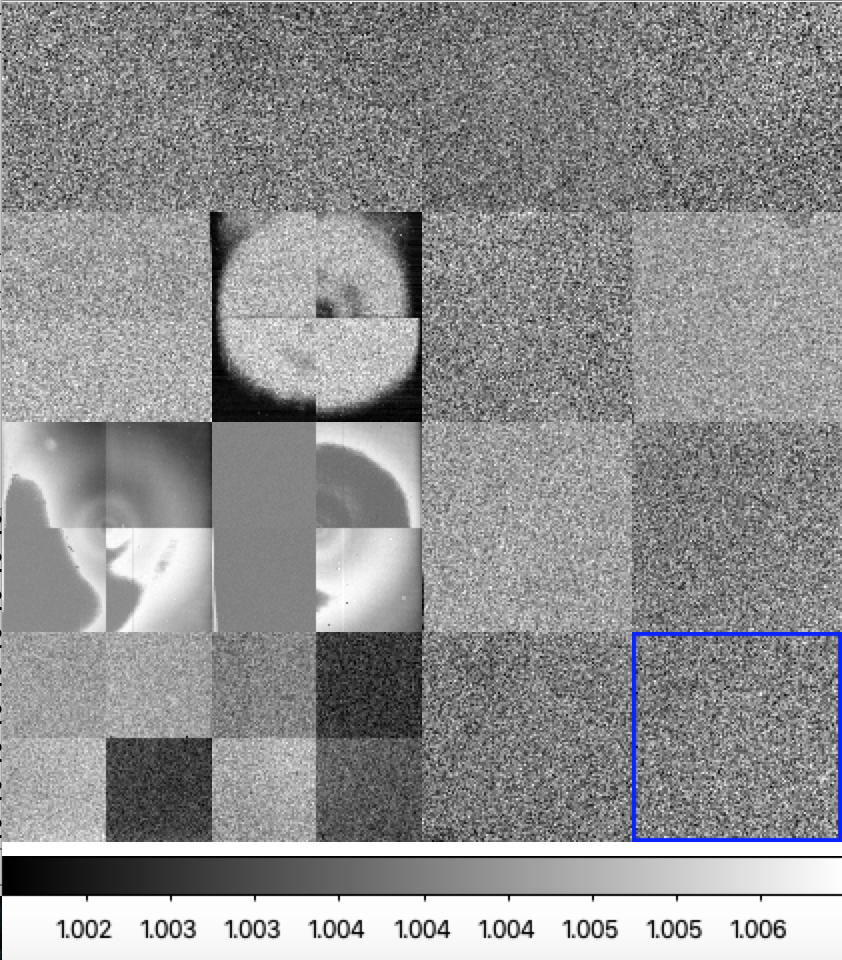
Full mosaic ratio image for the first images taken with LED 2 on 2020-06-20 to those taken on 2020-06-26.
The images above support our expectation based on the median values. As with the g-band sequence data, we don't see structure in the g-band images for CCD 11 taken day apart. However, like the i-band data all of the images in the low left quadrant of the camera show a significant variation between 2020-06-20 and 2020-06-26. This supports the idea that the variations here are related to a single archon.
Differences in G-band response between ZTF CCDs
In a median values plot above we showed that the response to light from different g-band LEDs appears to vary from one CCD to another.
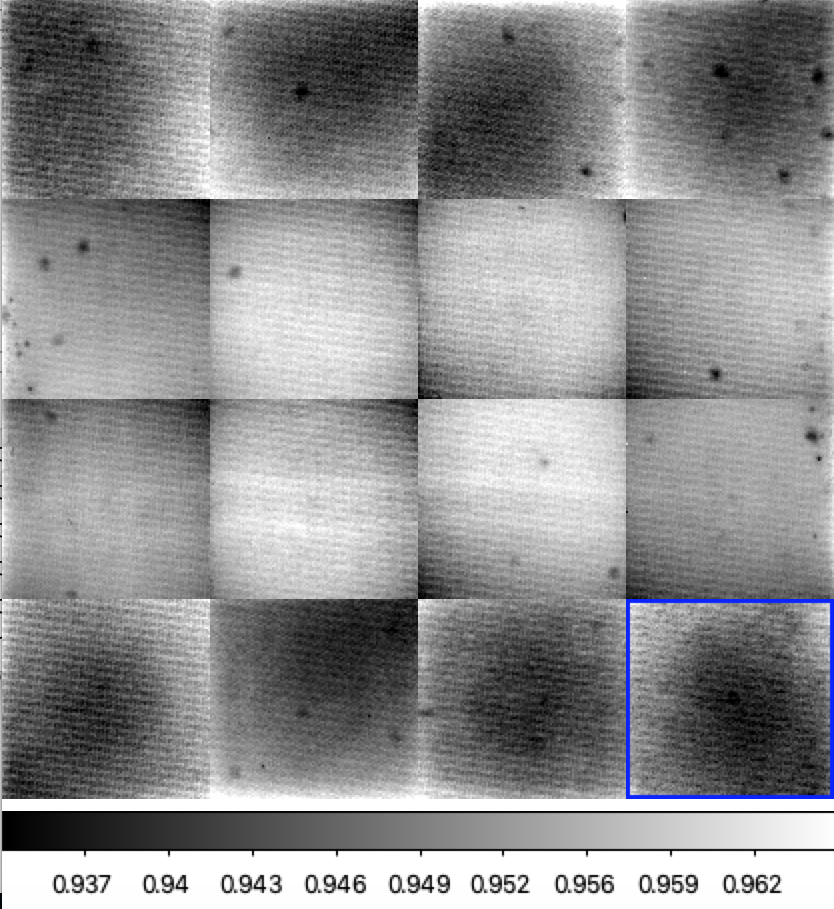
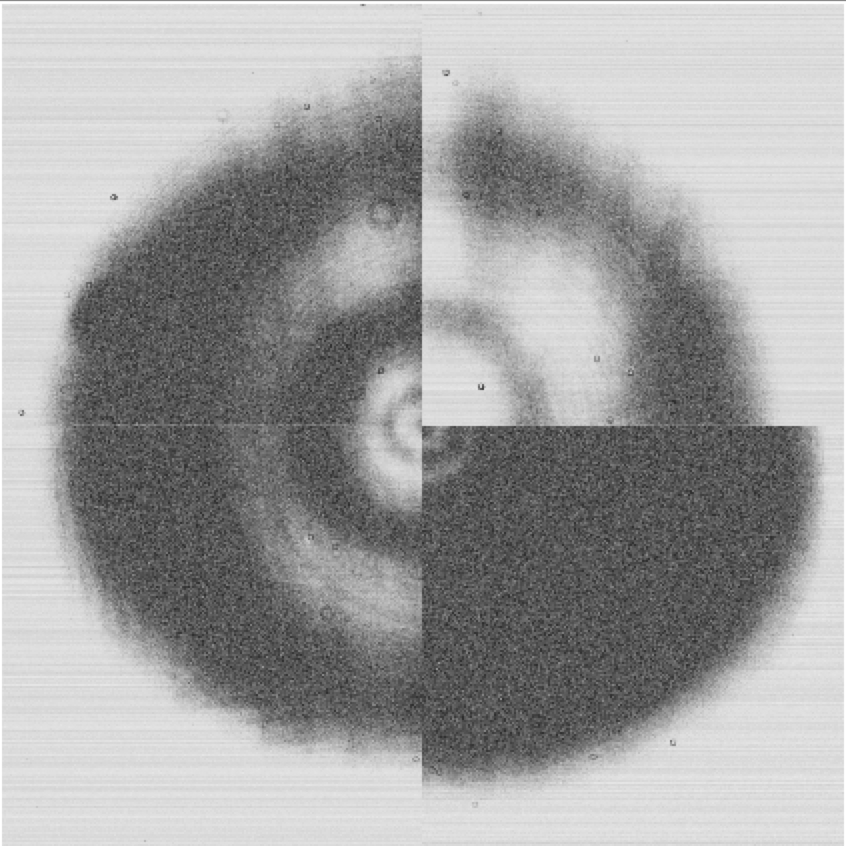
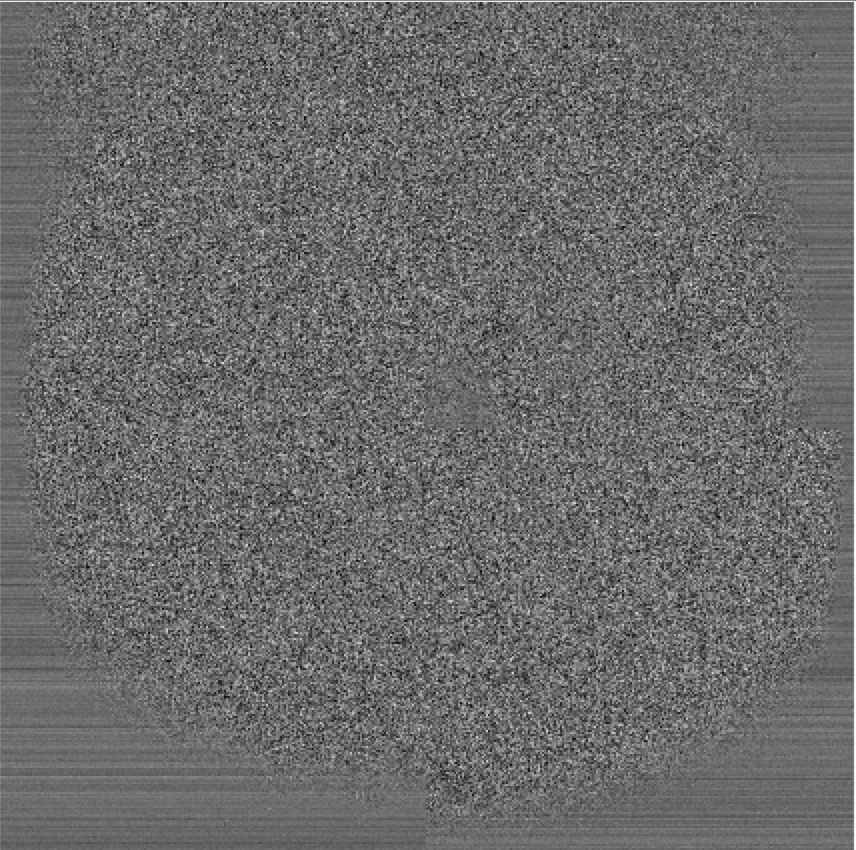
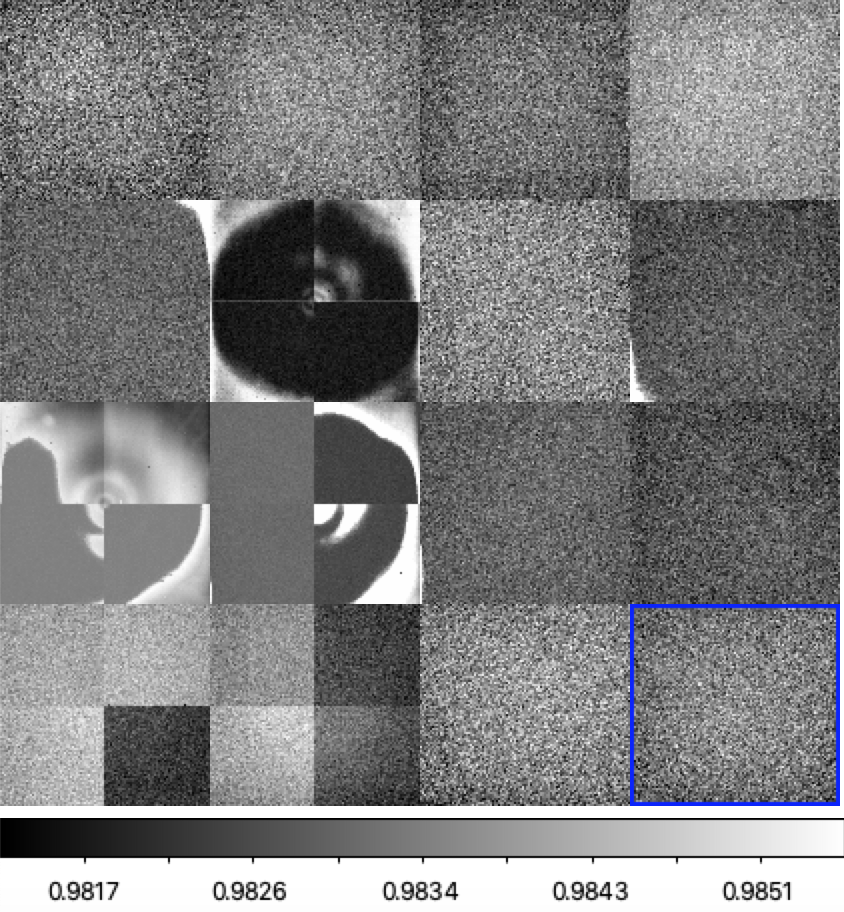
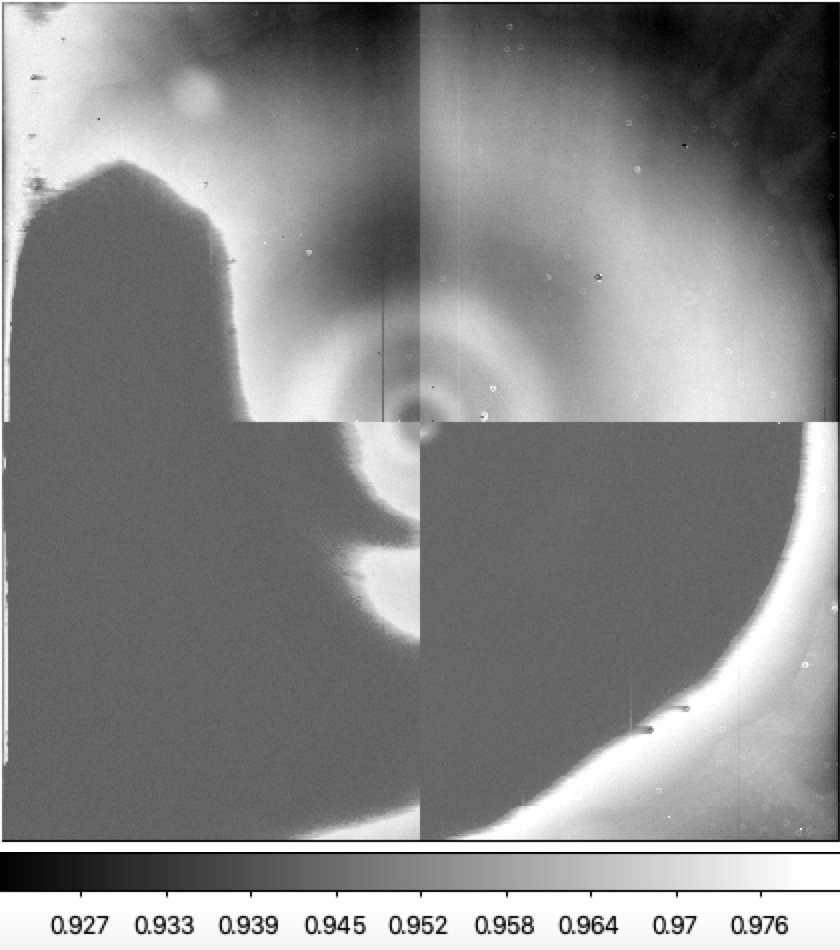
Full mosaic ratio image for the first image taken with LED 2 to that taken with LED 5 on 2020-06-20.
In the figure above we show the ratio of images taken with LED 2, to that of LED 5 from data taken on 2020-06-20. Here we see that there are significant variations from one CCD to another. These variations come from both dust spots and edges. The variations due to dust spots have been noted previously. The reason for the edge variations is less clear and probably not related to scattering off filters. However, it is clear that the AR coated CCDs in the middle two rows exhibit different structure than the outer two rows. This is completely consistent with our comparisons of g and r-band filtered and filterless flats.
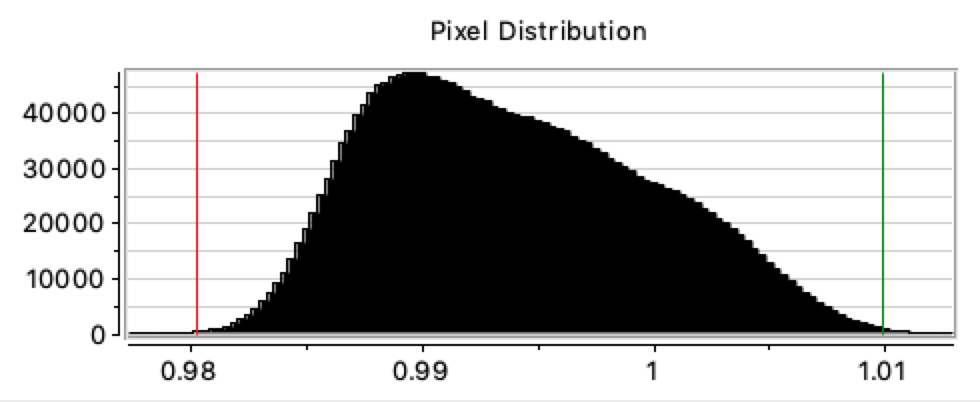
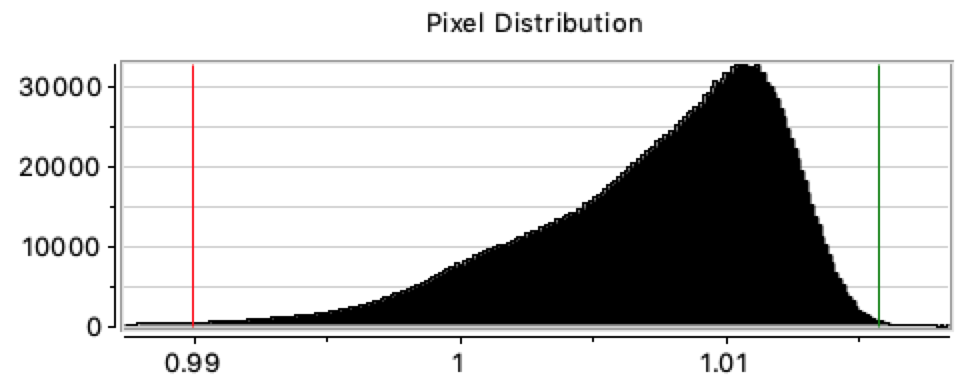
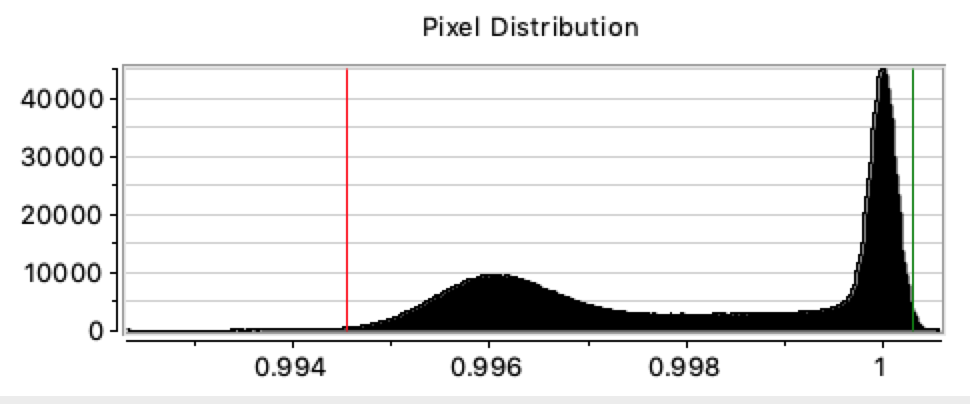
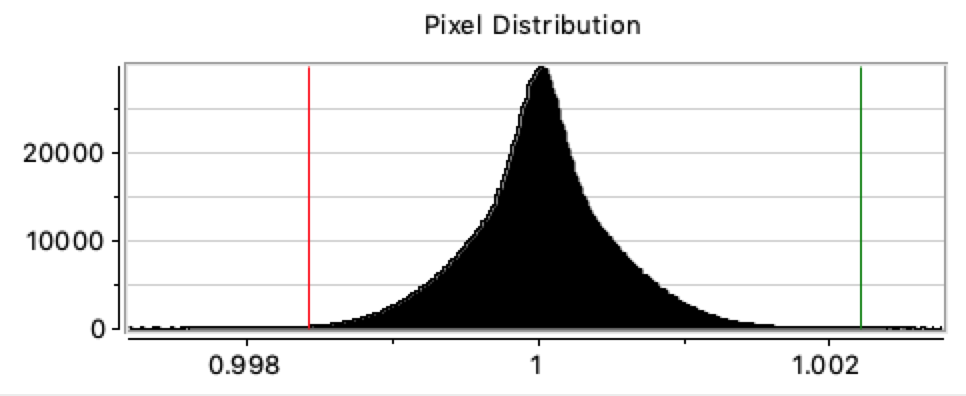
Pixel distribution for the ratios of images taken with LED 2 to those taken with LED 5 on 2020-06-20. The left plot is from CCD15 and the right in for CCD 11.
In order to contrast the CCDs in the inners rows with the outer ones, in the plot above we show the pixel distributions for two CCDs (11,15). In these plots we see strongly skewed between distributions that vary in direction. The CCDs in the top and bottom rows on the camera show a skew with a long tail to lower values, while CCDs in the middle two rows show a skew toward higher values. The shape of these distributions along with the images show that the spatial structure with the two groups vary between convex and concave. Thus the previous result was not representive of all CCDs.
The peaks of these distribution varies between each CCD by up to ~2%, suggesting sensitivity variation between each CCD at this level. We note that the g-band internal variation within a CCD is also about the level as previously shown.
Discussion
In this work we have evaluated variations between individual raw flatfields. In our previous work some of the rapid variations seen here were hidden within combined flats (that include multiple exposures from multiple LEDs).In this work we specifically find that there are significant variations between i-band flats taken in sequence. Based on the limited data analysed here the variations largely appear to be limited to a few CCDs. The cause of these variations is due to saturation in some of the i-band images after the LED flash times were increased. These increases starting from June 15th 2020 raised the levels in CCD 11 and the edges of some CCDs above the 60k saturation limits.
Additionally, we find that there a cases where groups of CCDs vary over a period of days. This appears to be on an archon level and is present in both g-band and i-band images. Although, the changes are most evident in the i-band images.
We confirm the variations in the response of the inner AR-coated CCDs and the outer ones in g-band, and find additional variations in response between the individual CCDs within these groups (as suggested by photometric solutions). The response variations in g-band do not appear follow the clear circular structure seen in r-band and i-band images.