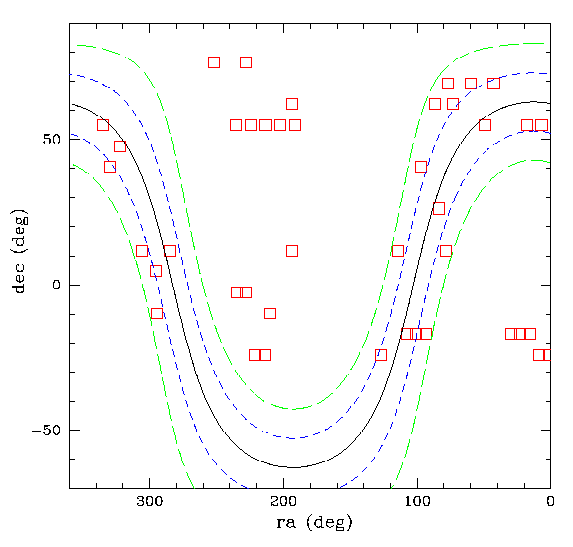
| Zeropoint uncertainties variations by field. |
| Data Flags for ZTF DR1. |
Goal:
Select a small sample of ZTF data that is representative
of the overall dataset. Use this to determine the images
and photometry that should be flagged within ZTF DR1.
Data requested for five separate sets of fields
to sample crowding, airmass, and distance for
equatorial pole:
1, 10 fields equally distributed along l with |b| < 10 deg,
2, 10 fields along l with 10 < |b| < 20,
3, 20 fields along l with 20 > |b|,
4, 10 fields along RA with dec < -15 (not included in those above),
5, 10 fields along RA with dec > 50 (not included in those above).
Received data for only 42 test fields.

Analysis:
Issues with the data are most clearly seen with the values of ZP and ZP_rms
and the number of calibrator star matches. These parameter selections are
mainly based on the quality discriminators presented in the ZSDS (section 13.4).
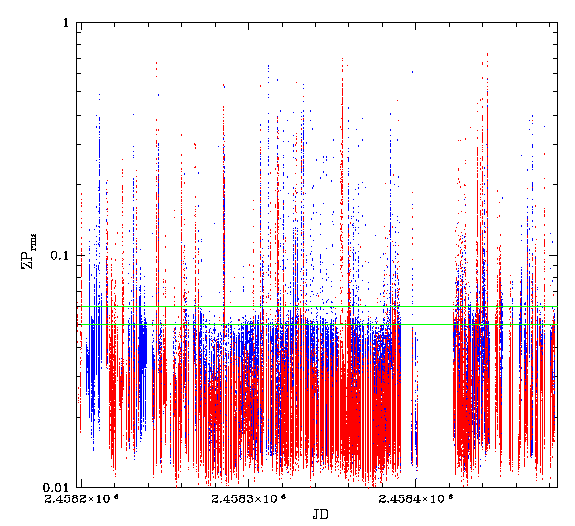
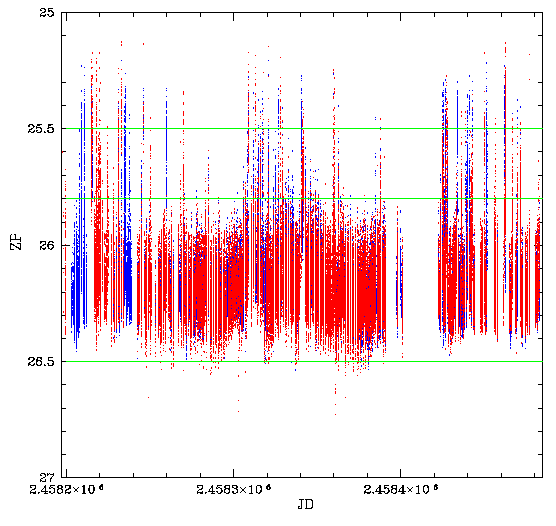
Observations containing likely bad data are clearly seen to have uncertain values of ZP from the calibration. Likewise, the bad observations have smaller ZP values that are likely caused by a combination of clouds and lunar illumination.
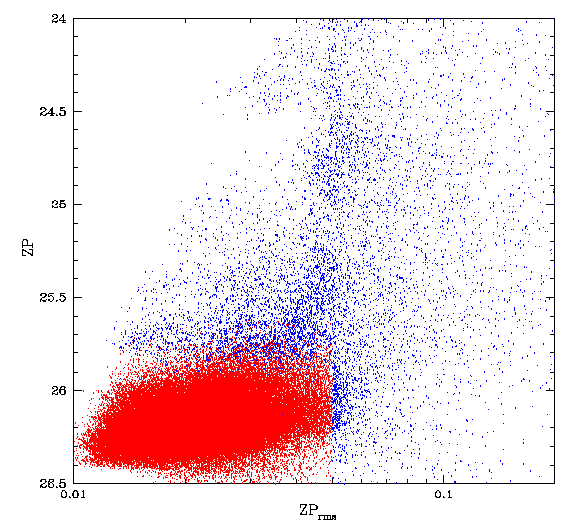
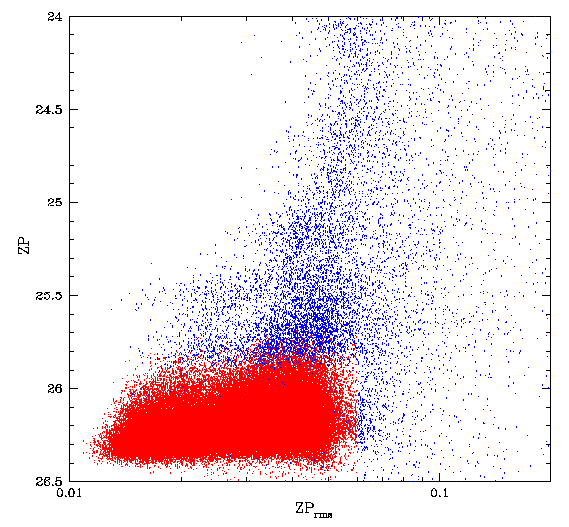
The distribution of frame ZP and ZP_rms values.
Left: ZTF r-band data. Right: ZTF g-band data.
The flagged data is given by blue points and the presumed
good data by the red points.
Well calibrated (and presumably good) data is located in a distinct region of ZP vs ZP_rms space. However, some of this data may still be usable, so multiple cuts were ZP devised.
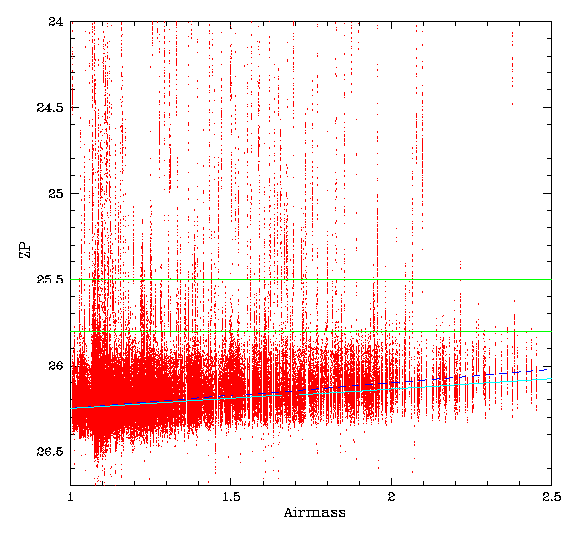
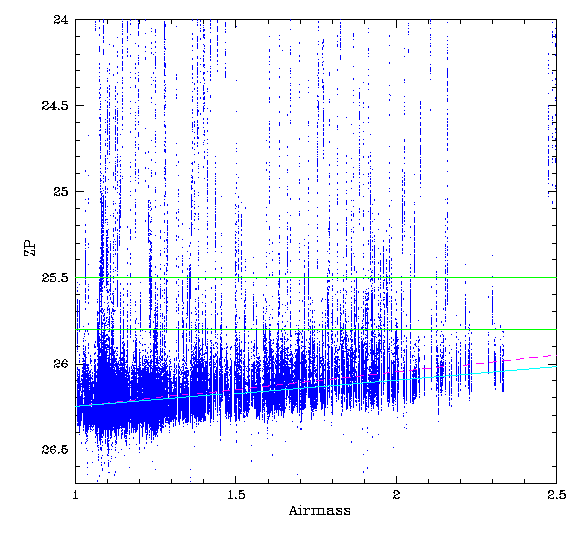
The distribution of ZP with airmass.
Left: The ZTF r-band data.
Right: The ZTF g-band data.
The solid lines show the ZP cuts used, and the trend.
The dashed lines show the airmass trend.
The cyan lines show the values from Ofek for PTF.
As expected there is a clear trend in ZP with airmass. For r-band this is ~0.15 mags/airmass and for g this is ~0.2 mags/airmass. These values vary slightly from the values found for PTF of g=0.23, r=0.112 by Ofek. Hayes and Lathem (1975) gave values for Palomar of g at 4800A=0.206, r at 6250A=0.115, z at 7000A=0.07. In comparison, for PS1, Tonry et al. (2012) gives g=0.22, r=0.13, i=0.09, z=0.05. Further work is need if these values are to be used for something other than quality cuts.
Results:
For ZTF r-band, data is flagged with any of:
zp > 26.65 - 0.15*Airmass
zp_rms > 0.05
numps1calmatches < 120
zp < zp1_threshold[quadrant] - 0.15*Airmass
or
zp < zp2_threshold[quadrant] - 0.15*Airmass
For g-band:
zp > 26.7 - 0.2*Airmass
zprms > 0.06
numps1calmatches < 80
zp < zp1_thres[quadrant] - 0.2*Airmass
or
zp < zp2_thres[quadrant](col 3) - 0.2*Airmass
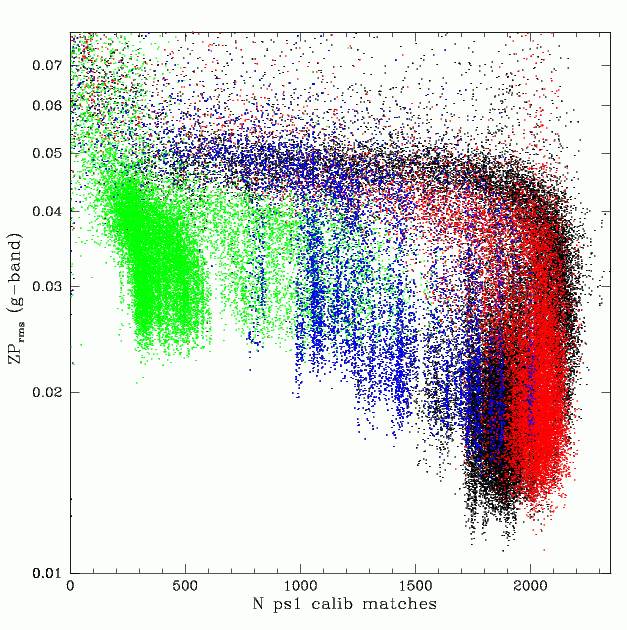
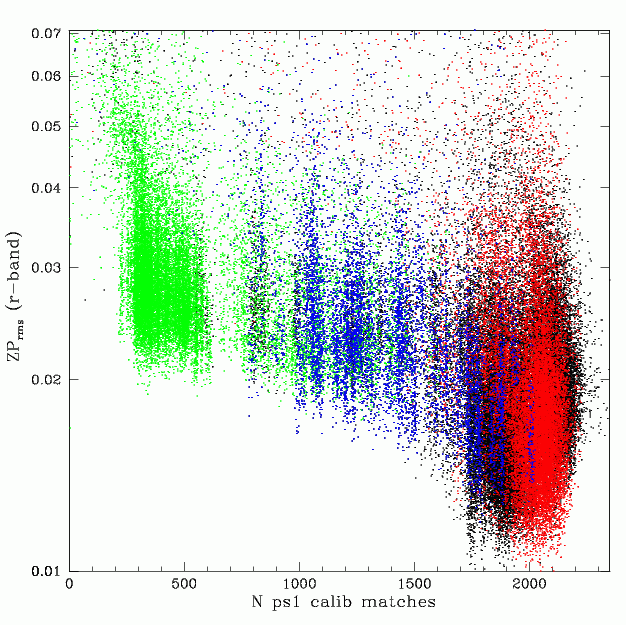
Zero point rms vs the number of PS1 star calibrators in a quadrant
for DR1 fields.
Selections are: black (|b| < 10 deg), 2= Red (10 < |b| < 20),
3= Green (20 > |b|), Blue (field 539, l=44.3, b=3.6 deg).
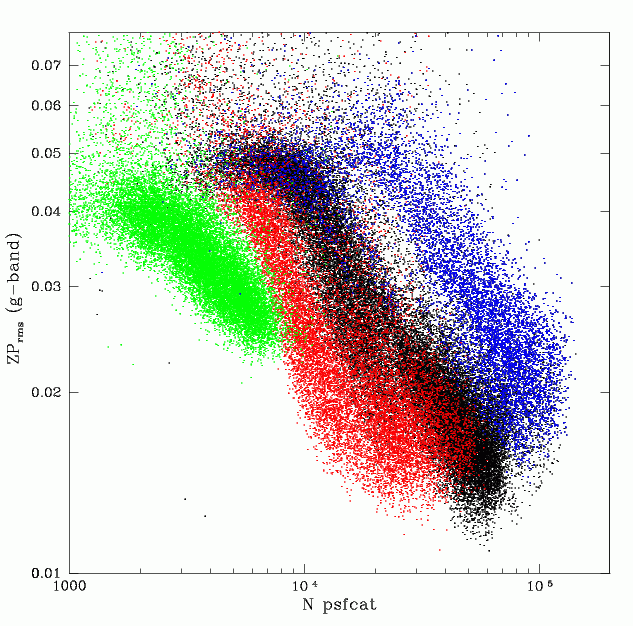
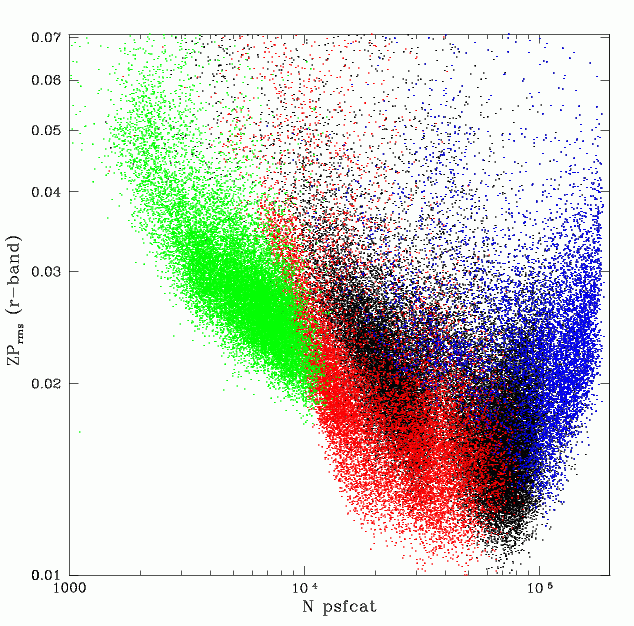
G and r-band zero points vs number of the number
of ZTF catalog sources within a quadrant. The colour selections
are as above
Conclusions:
1) The RMS for ZP values in high galactic latitude fields are generally
large due to the lack of calibrator stars within a quadrant. As the
number of stars increases at slightly lower Galactic latitudes
the additional calibrator stars reduce the scatter.
2) At very low Galactic latitudes, crowding effects mean
larger numbers of stars are required to reduce the ZP scatter.
When there are more than ~90,000 stars in a quadrant
crowding/blending simply drives the ZP scatter up.
3)The g-band data appears much more affected by crowding
than the r-band data since the RMS stays high even with
large numbers of calibrator stars. However, there may
be another cause.