Filterless flat ratios vs ZTF g-band error maps
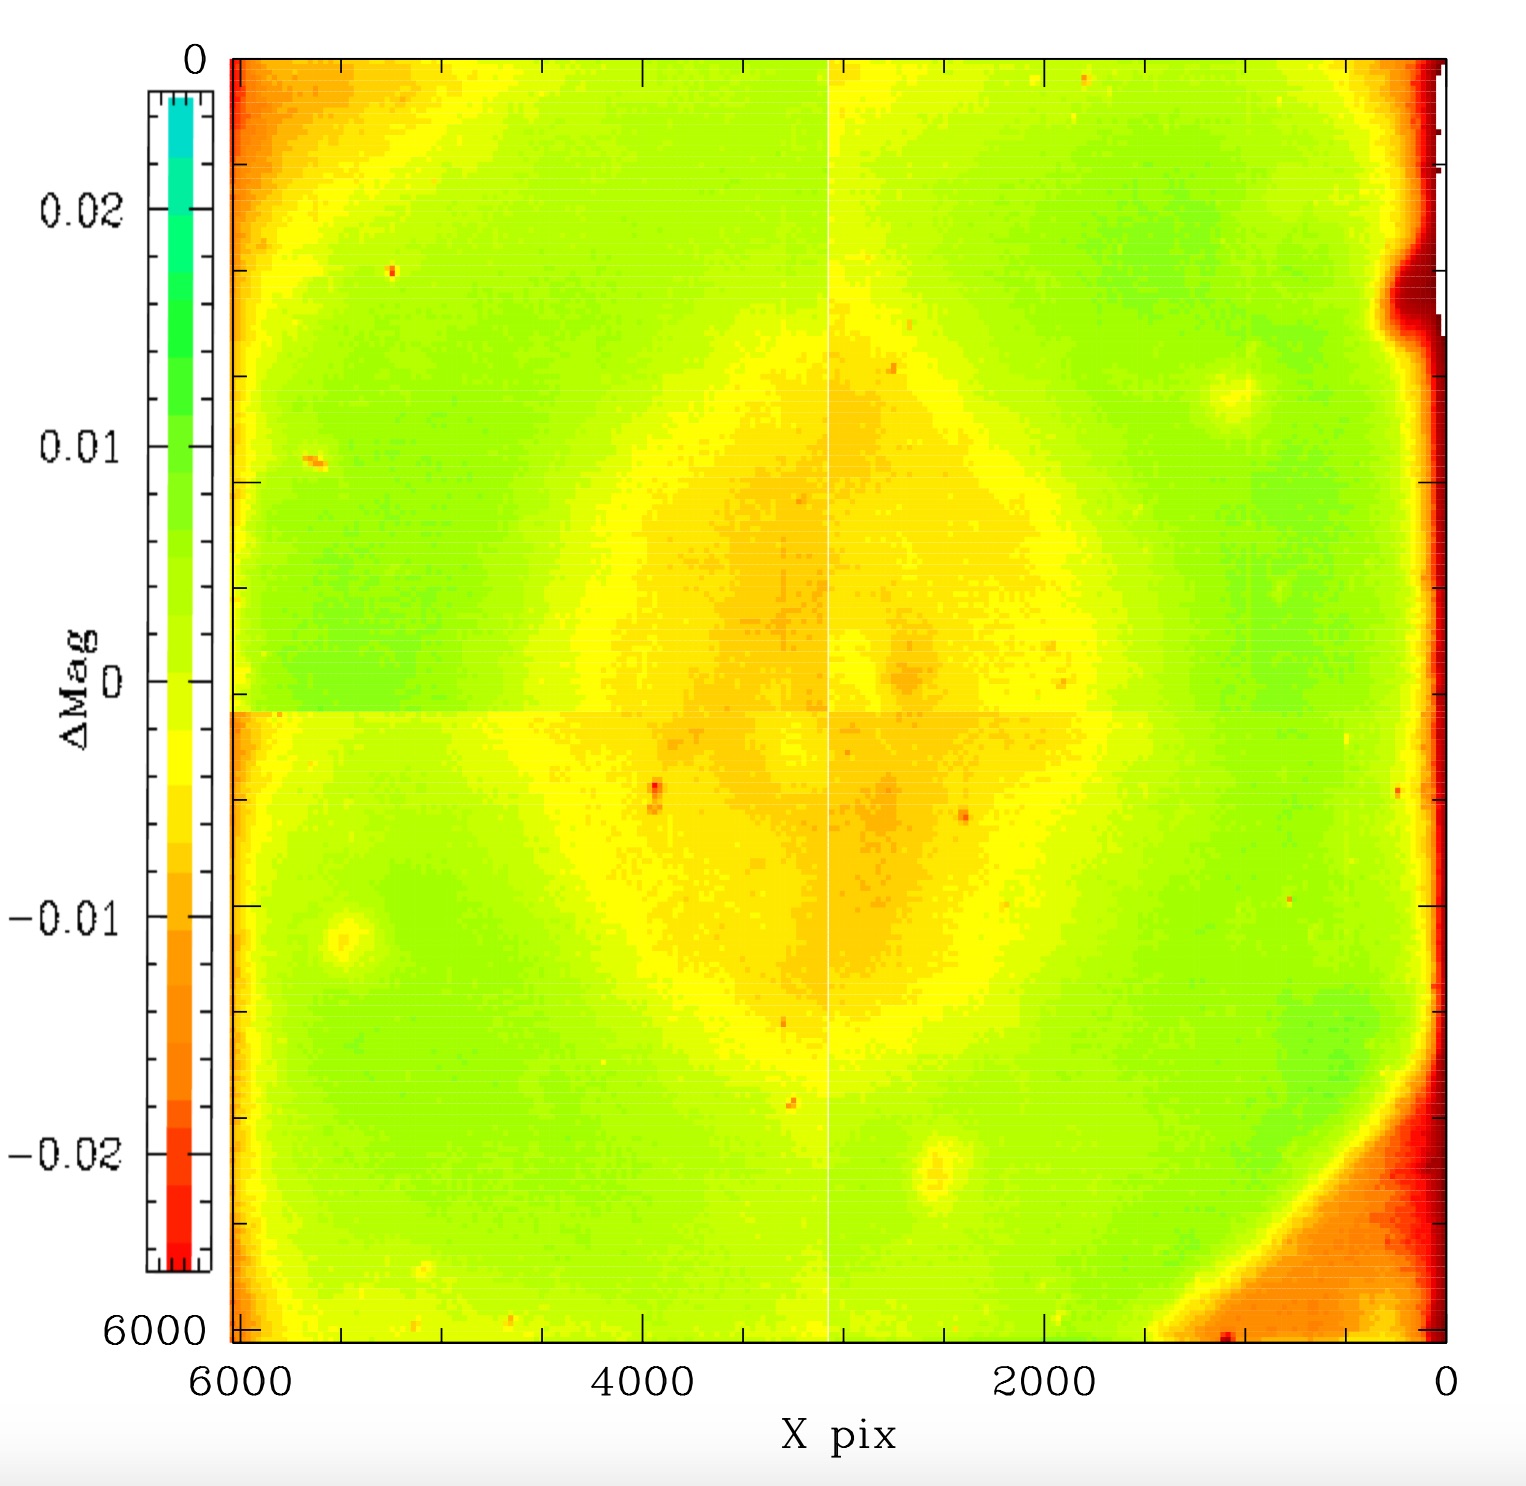
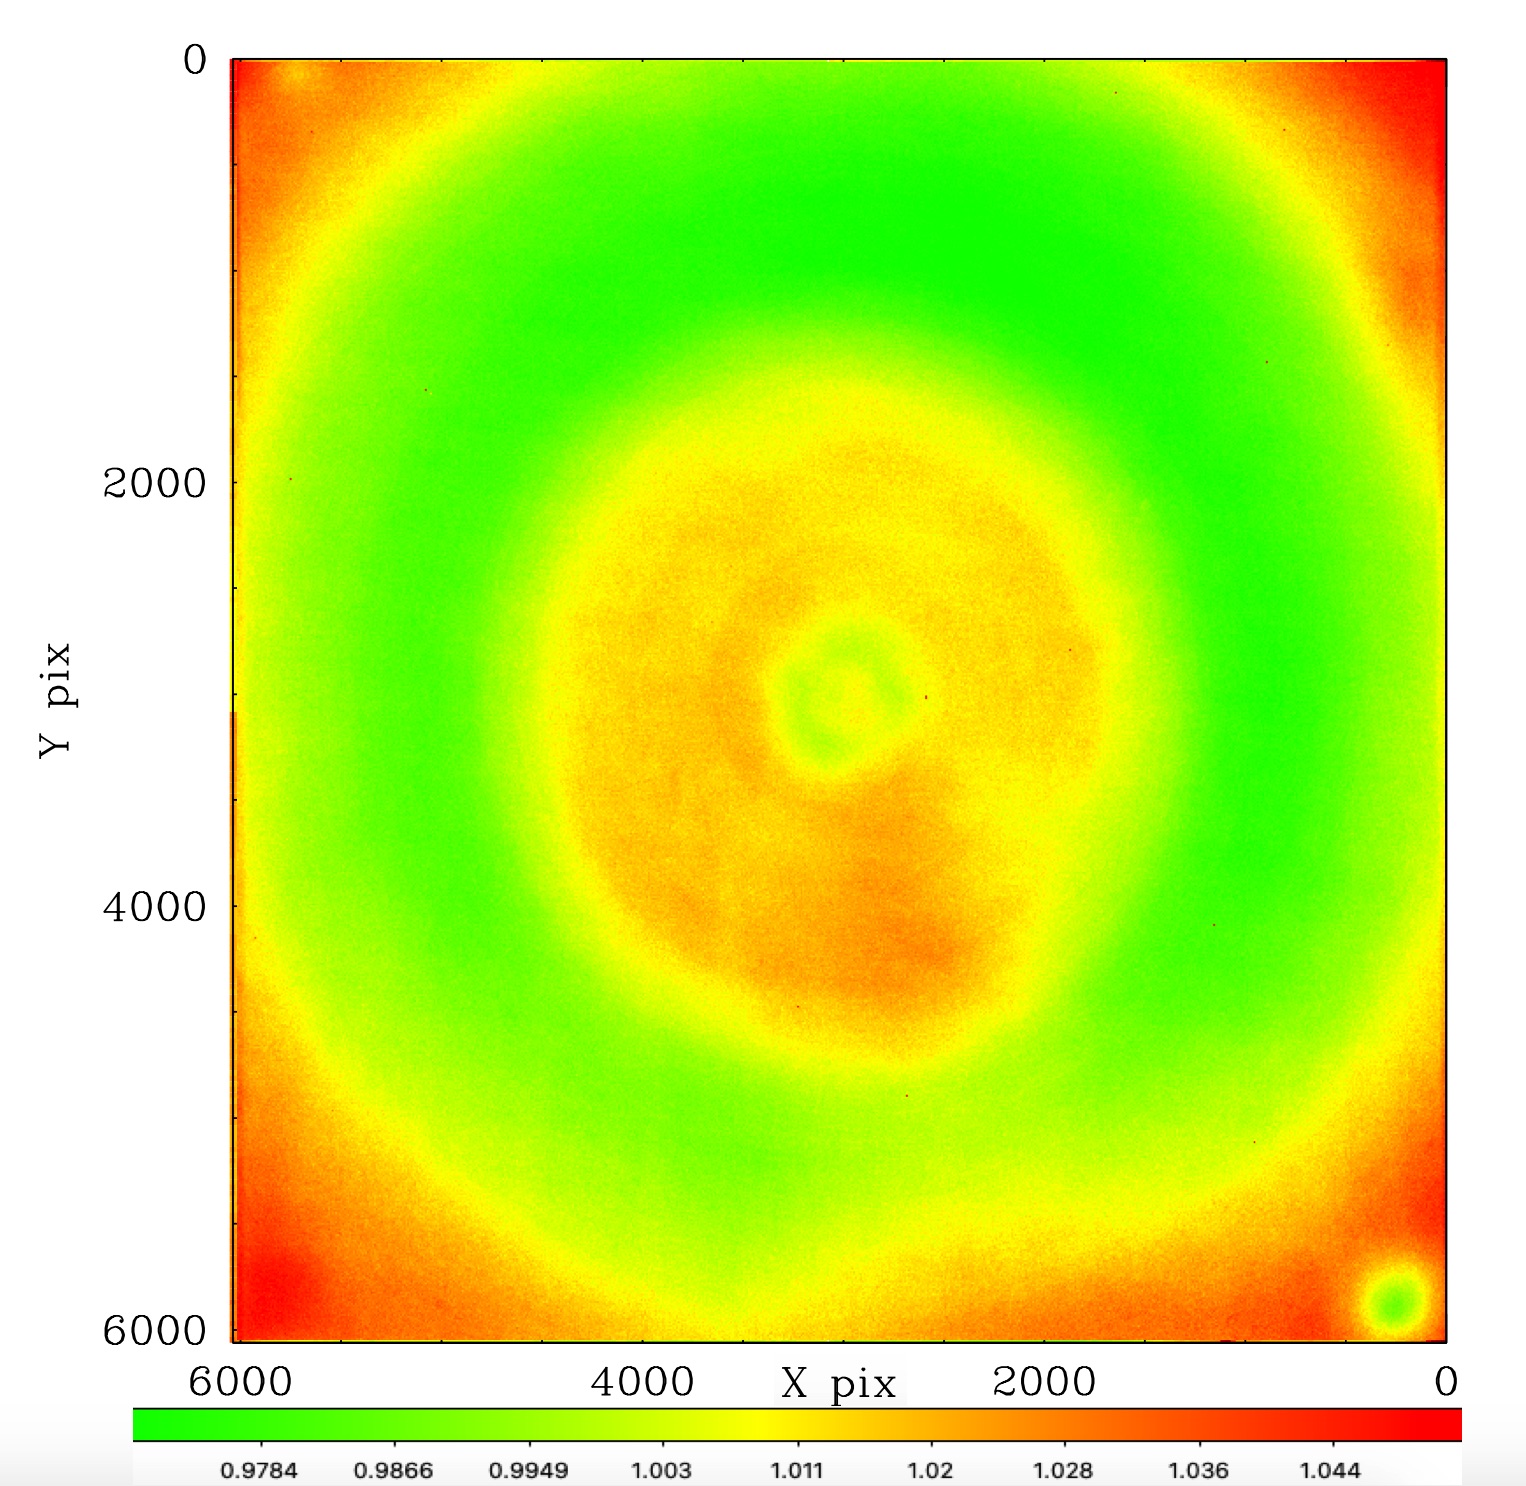
A comparison between the filterless flat ratio of LEDs 9 and 13 and the error map for CCD 01. The error map is left and the LED ratio image is right.
In the plot above we very roughly compare the rainbow colour map for g-band photometric residuals with the ratio of filterless flats. These ratio values are believed to represent the variation in CCD thickness. This plot simply shows that the flatfield ratios of from separate LEDs have similar circular structure and features. This was already known from our prior analysis of filterless flats.
To better compare the flatfield ratios values with the error map values we bin the values to the same scale as the error map (240x240) and plot the binned values.
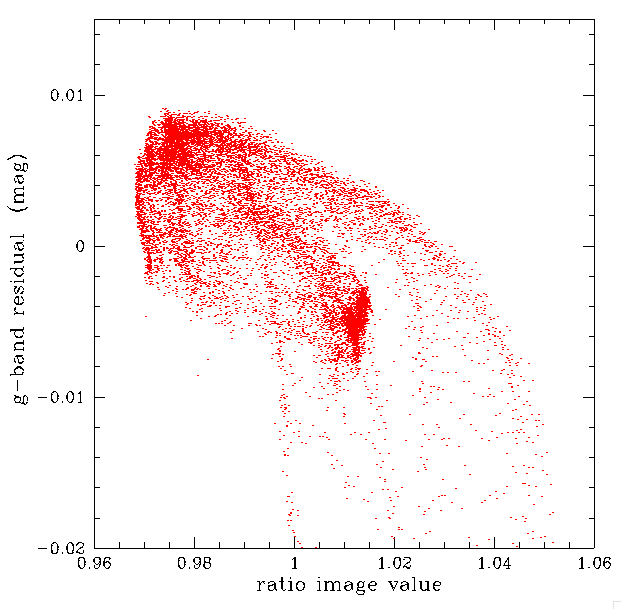
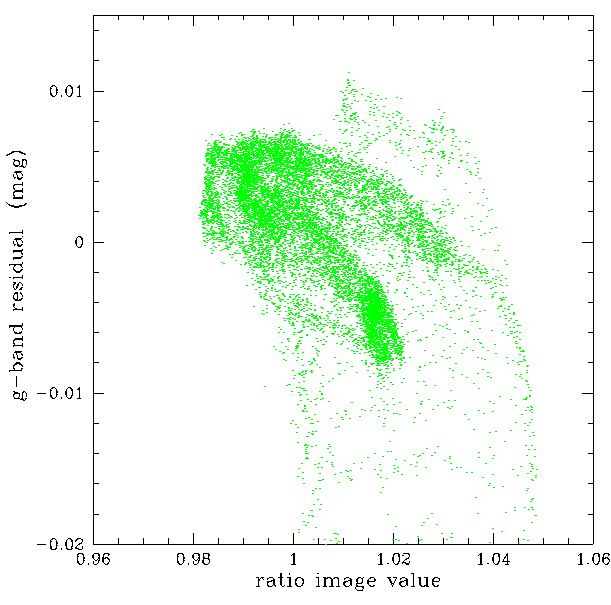
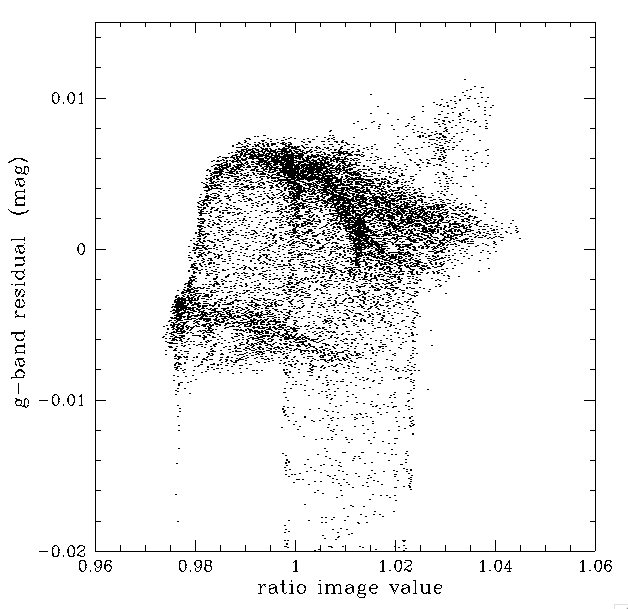
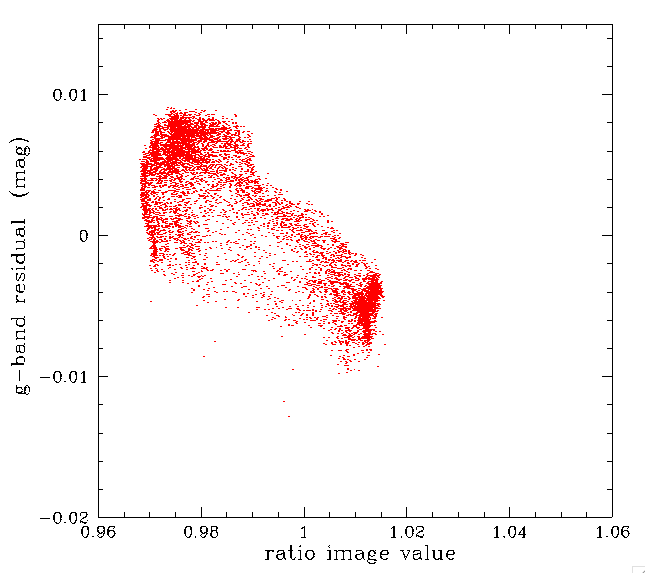
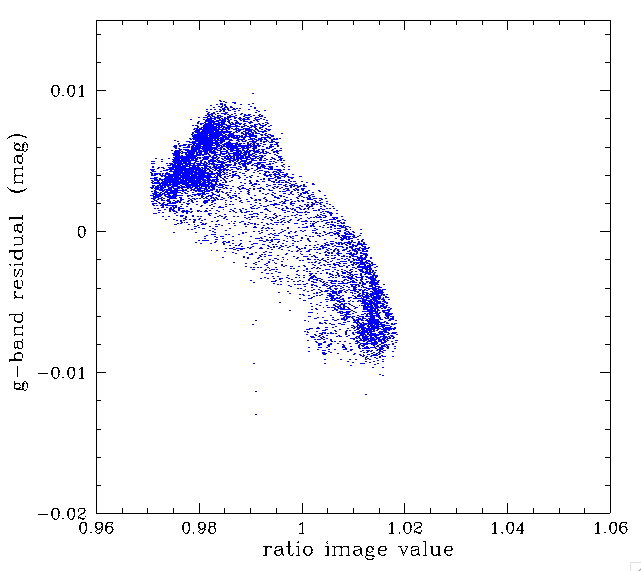
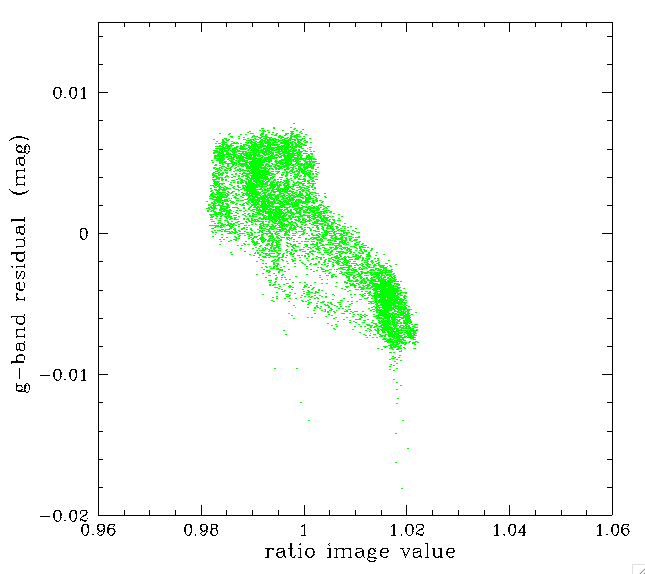
A comparison between binned filterless flat LED-ratio image pixel values and the error map values for CCD 01. Red: quadrant 1, blue: quadrant 2, green: quadrant 3, black: quadrant 4.
In the above plots we can see that photometric residuals for calibrated ZTF g-band photometry is correlated with the values in filterless flats made using LEDs 9 and 13. We divide the data into four quadrants since there are photometric offsets between quadrants due to variations in processing.
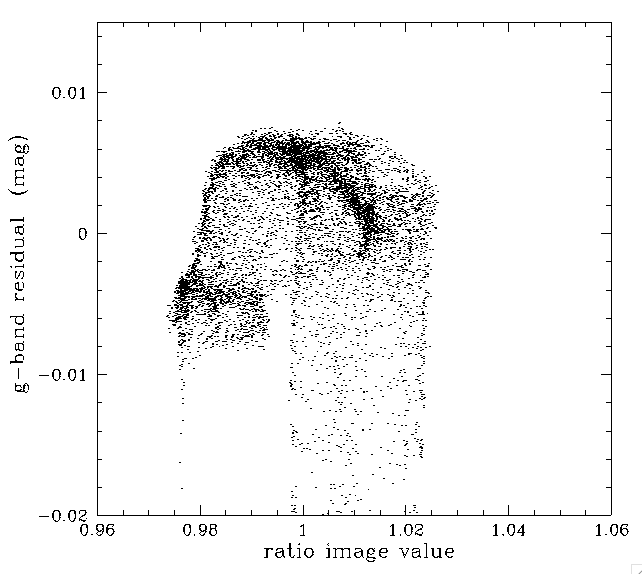
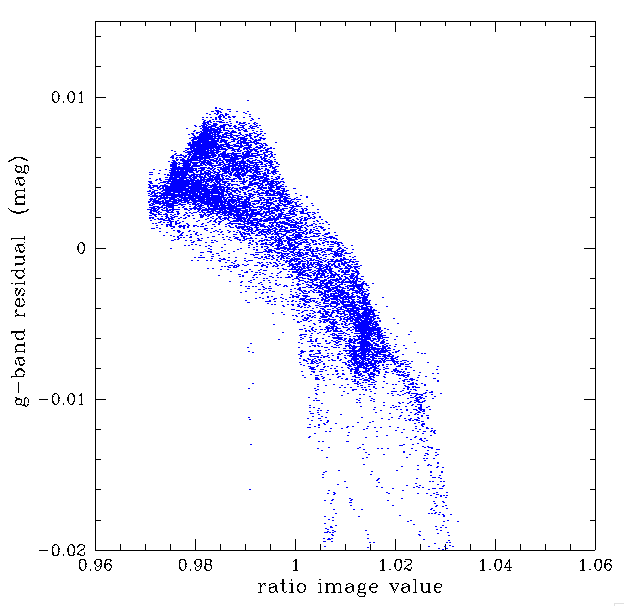
As above, but for pixels lying within a 110 pixel radius of the central pixel. Red: quadrant 1, blue: quadrant 2, green: quadrant 3, black: quadrant 4.