In order to correct for both the colour and magnitude systematics, the median photometry for every source with more than 50 observations per field was download from IPAC using a TAP service and matched and calibrated to PS1 stars.
Since the current ZTF calibrations do not account for difference in the extinction observed between PS1 vs ZTF filters, one obvious cause for systematic differences with colour are differences in extinction.
As a first step we separated between low extinction fields (E(B-V) < 0.1) from high extinction ones to see if the systematics with colour were consistent within the sets. However, is it was clear that the colour systematics varied even among the low extinction fields.
To see whether there was a more direct relationship between the extinction within a field and the colour dependence of the photometric residuals, we decide to look at how the calibration colour coefficents varied with reddening. The initial plots showed a strong relationship in r-band. However, the values of E(B-V) given for ZTF fields were found to be too inaccurate for approximating the the extinction. (Even at the enter of the field where the values were expected to be accurate, althoguh these values may have been averaged over the values with a field).
Since reddening can vary on small spatial scales we decided to derive an approximate value for each quadrant in every field by averageing the Schlegel et al. E(B-V) values on the corners of every quadrant of the ~500 well observed ZTF fields. Below we plot this along with the median colour coefficent used to calibrated ZTF photometry in a quadrant to PS1.
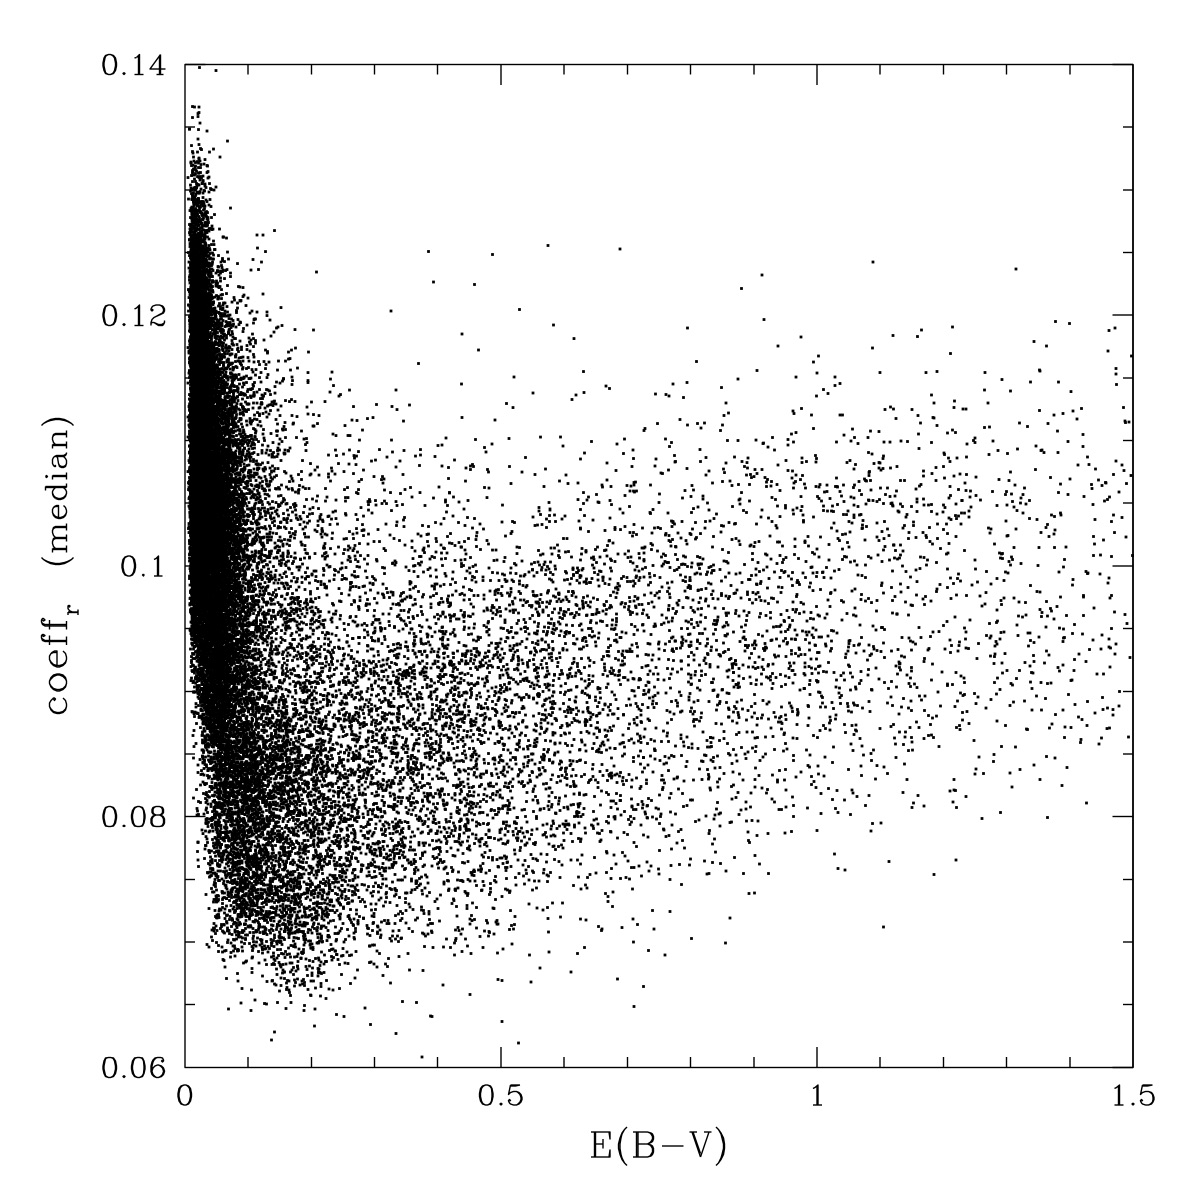
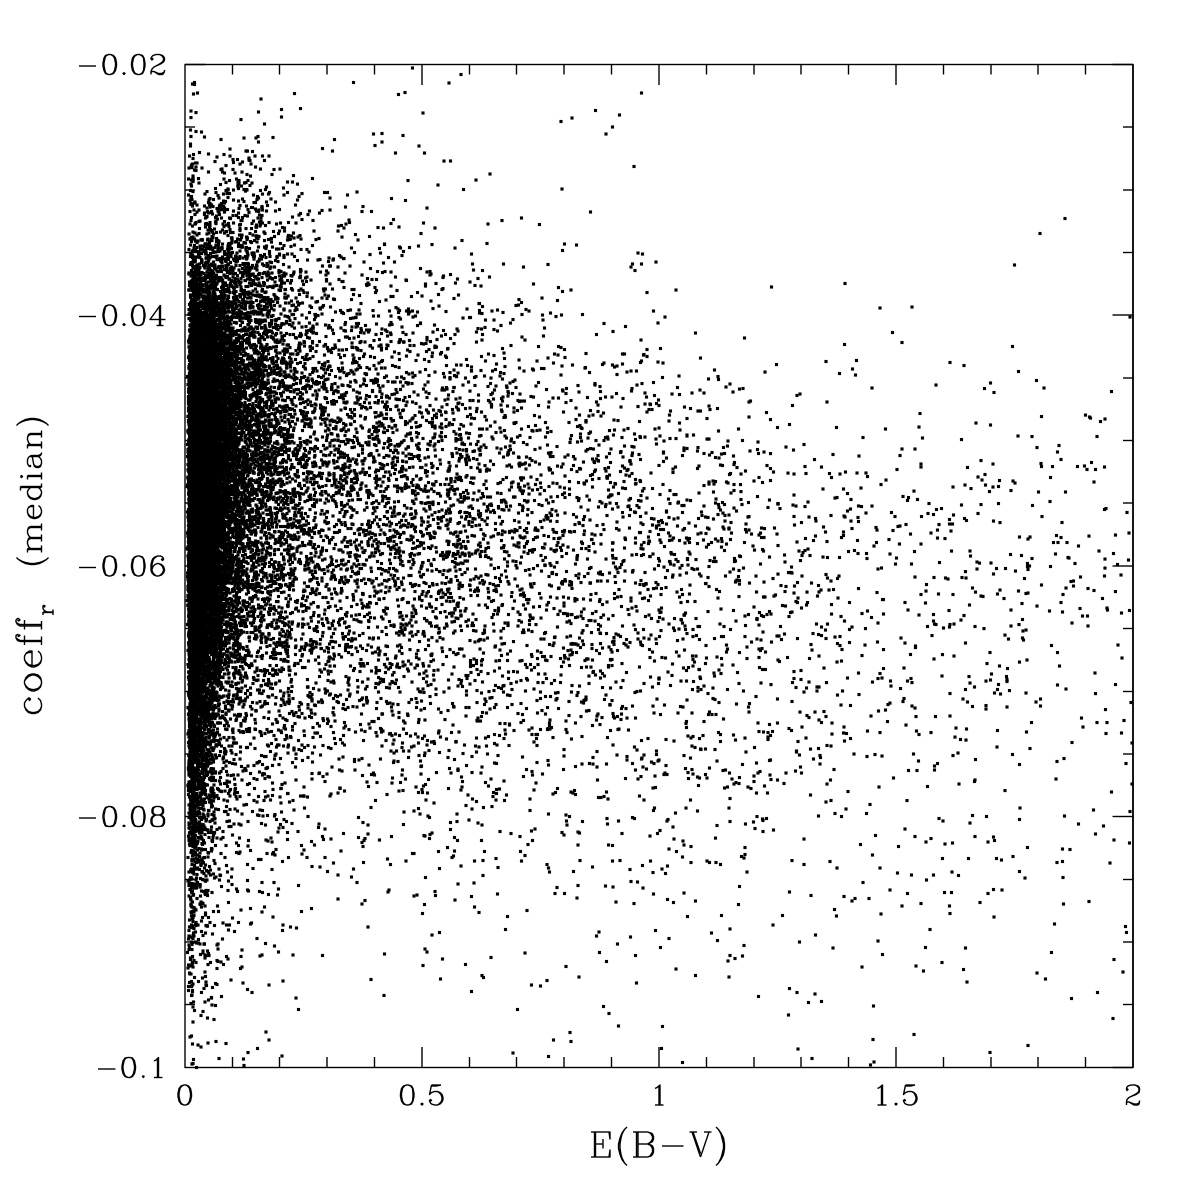
Median r-band colour coefficients and average extinction values for ~34,000 ZTF quadrants with > 50 observations.
Here we see that there is a very strong variation in the median photometric colour term required to match PS1 with reddening. However, the relationship exhibits very significant scatter. Additionally, it is not clear why the distribution shows an inflection point at E(B-V)~0.1 rather than simply increasing.
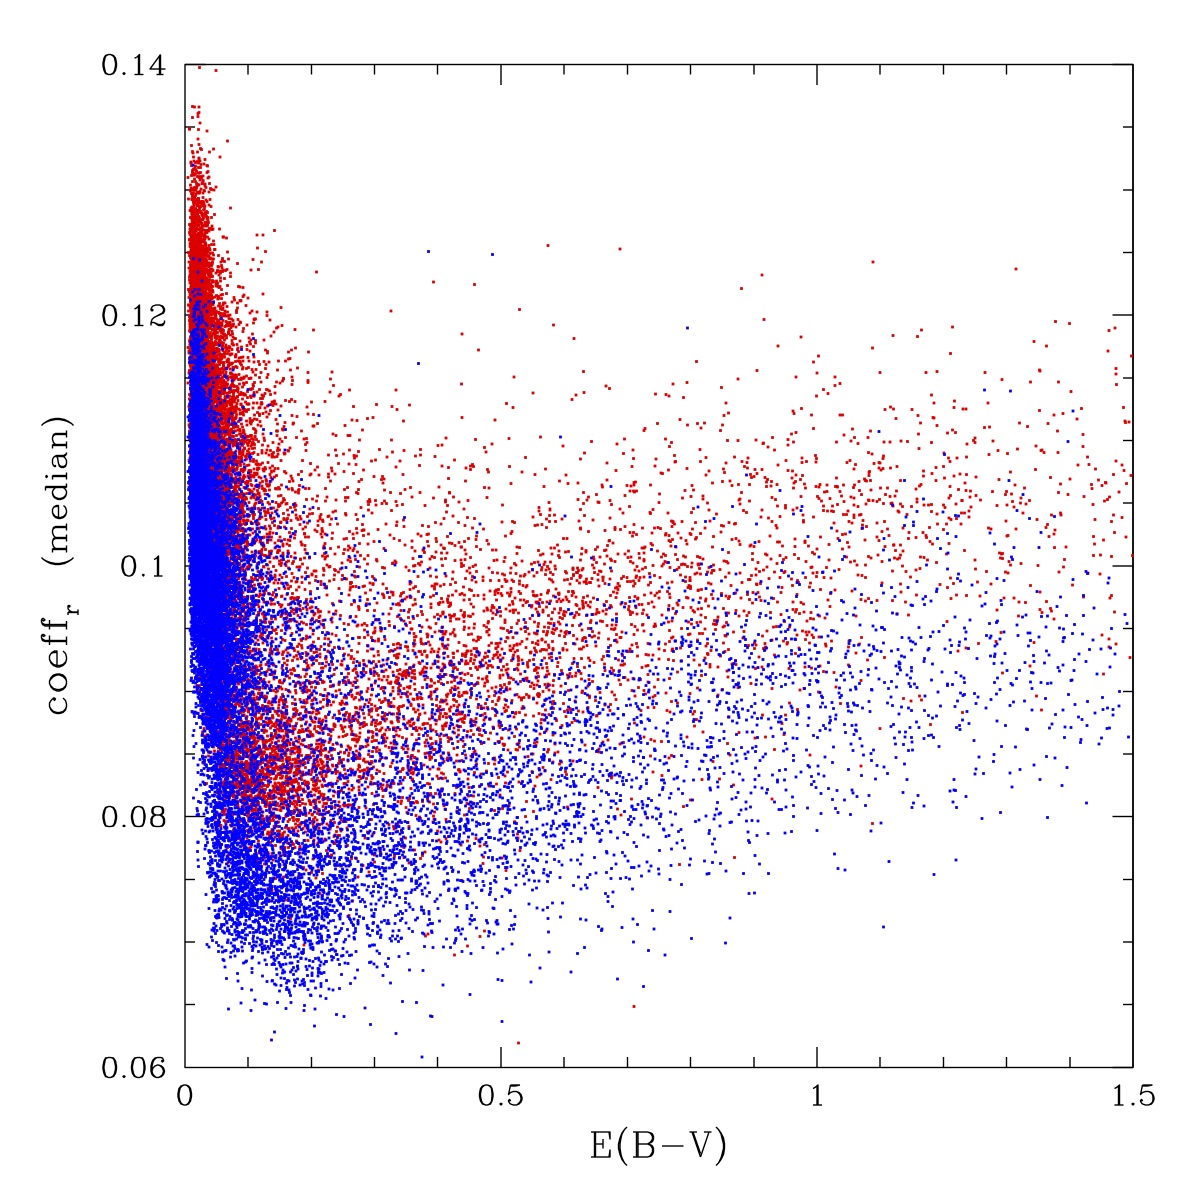
Median r-band colour coefficients and average extinction values above after separating CCDs with extra AR coatings (red) from the other CCDs (blue).
Considering that the ZTF CCDs include different AR coatings on the central CCDs vs those near the edges it was expected that some of the scatter was due to different colour response. Indeed, when we separated the results in the two different sets we see vary different colour coefficients.
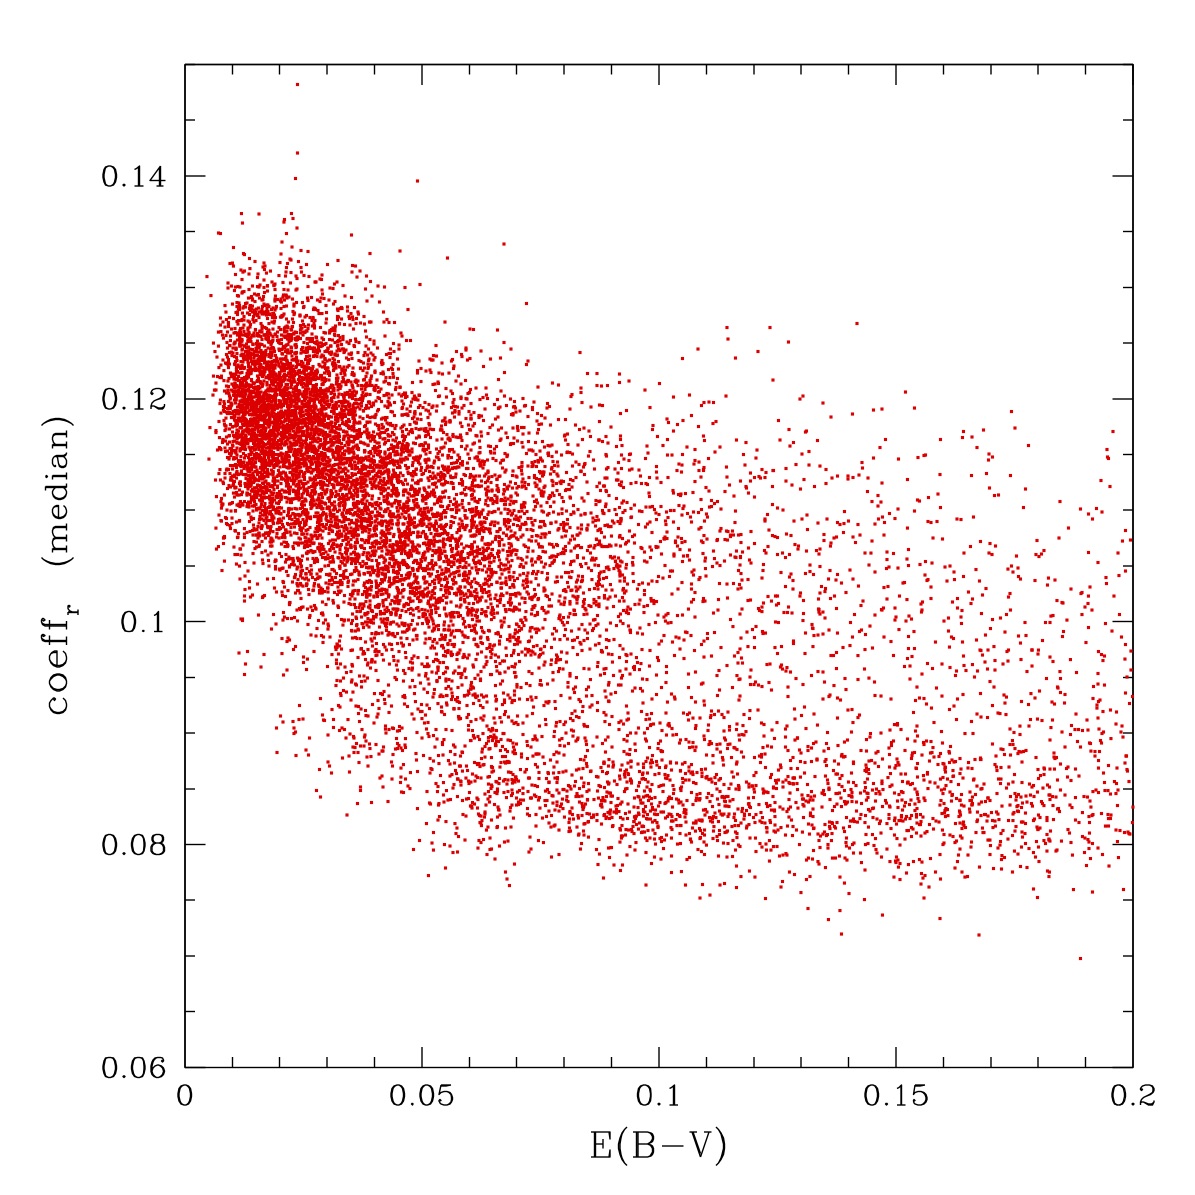
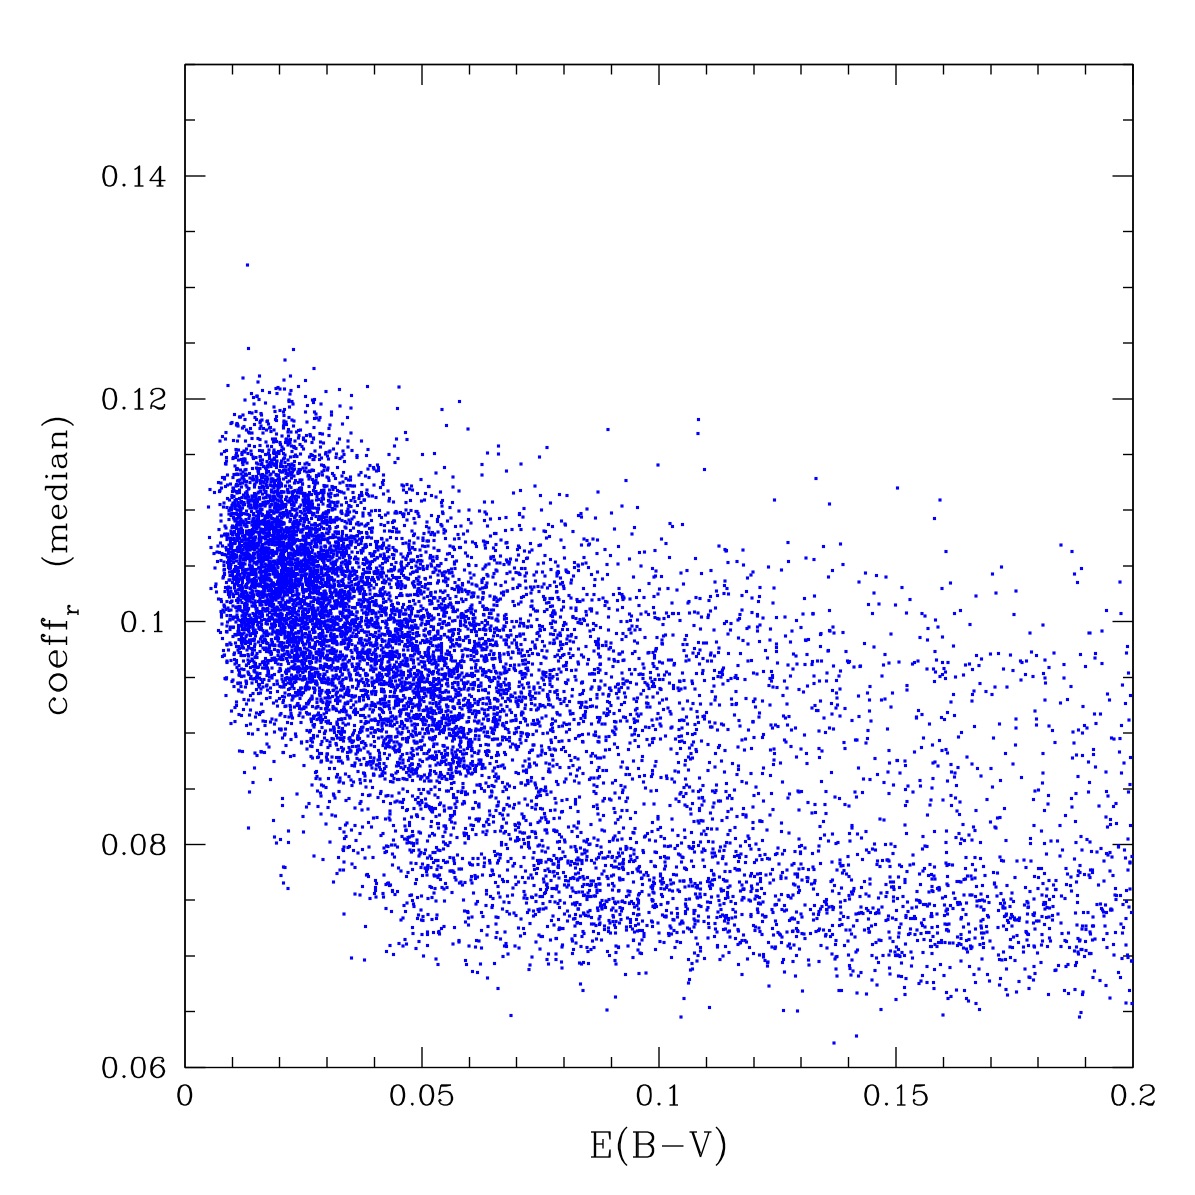
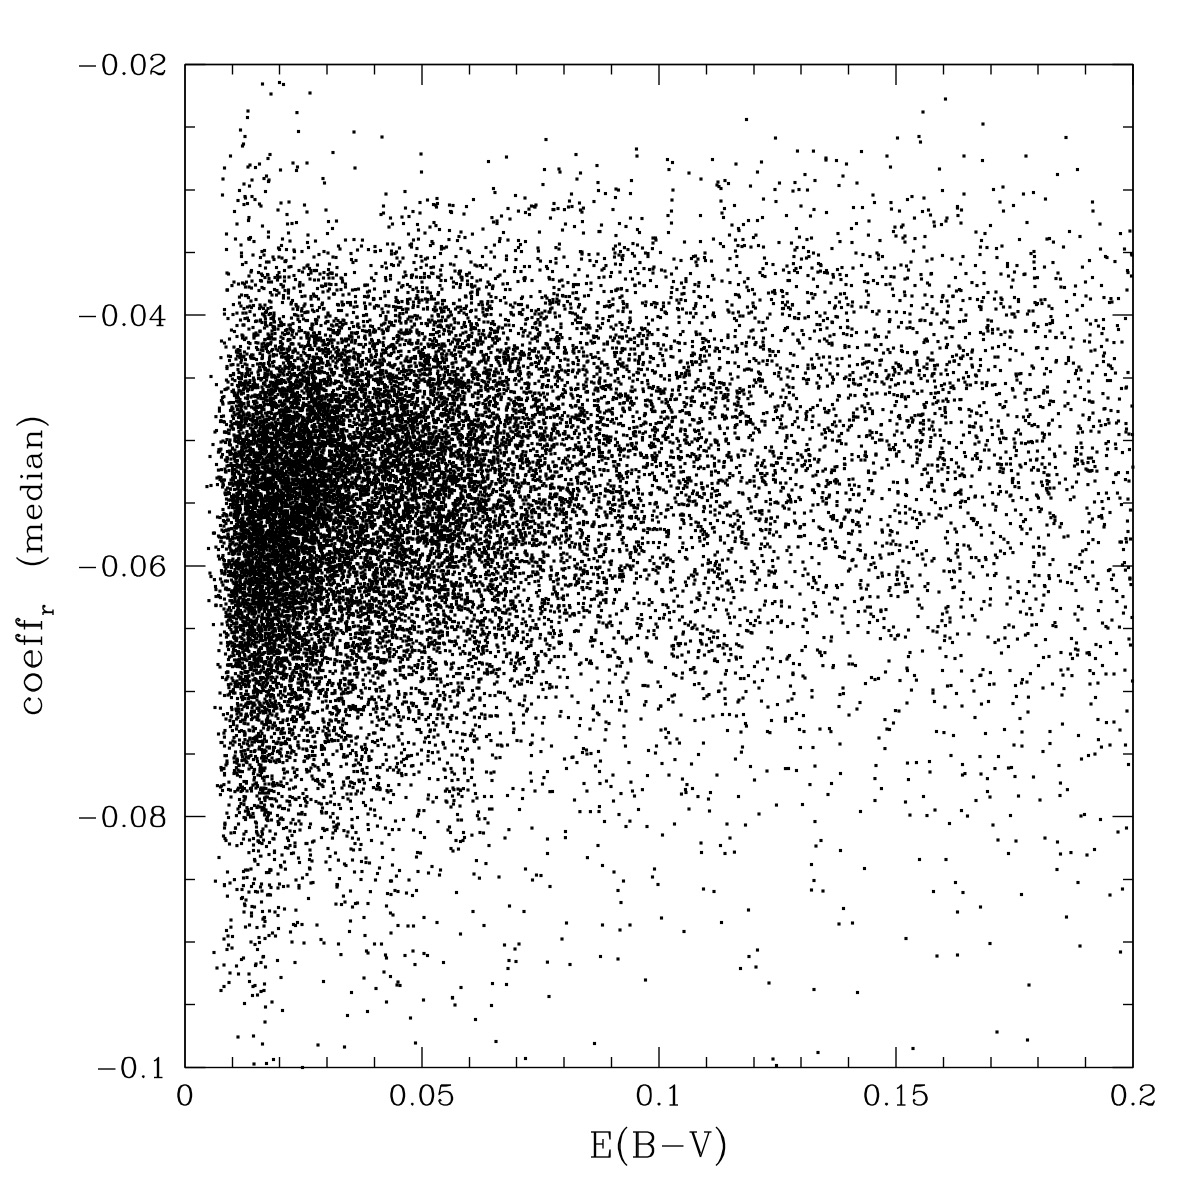
Median r-band colour coefficients and average extinction values above after zooming in to small reddening values.
When we look at the low-reddening end we see that the distribution is actually complex. However, the distributions are in fact very similar, with the only obvious difference being an offset of 0.01 between them.
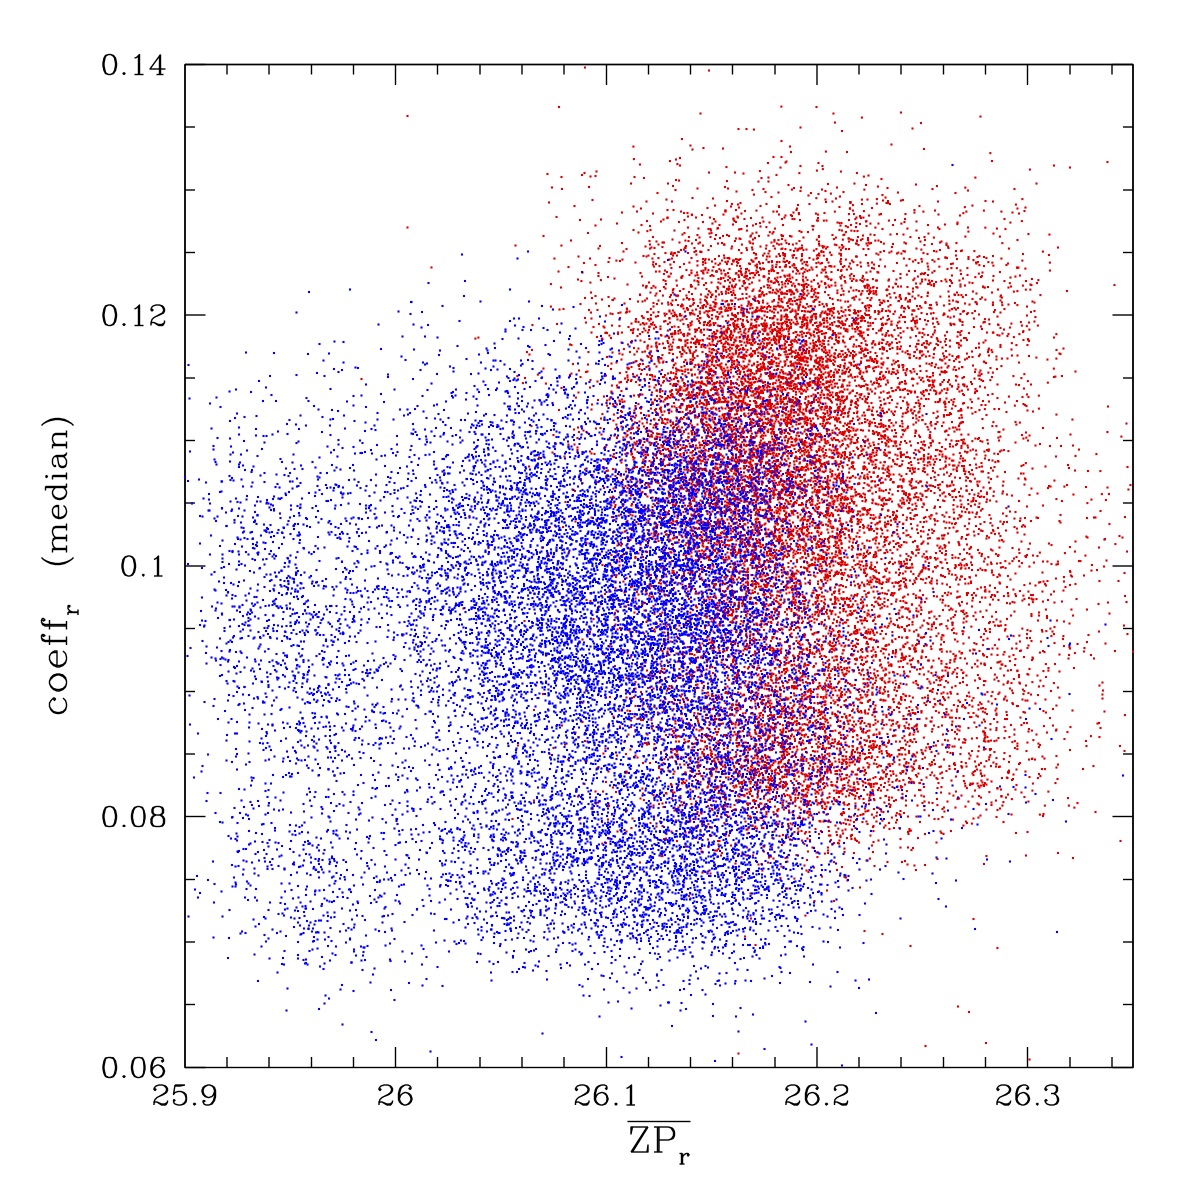
Median r-band colour coefficients and average zero points for each quadrant. Red points given the inner two CCDs rows (CCDs 5,6,7,8,9,10,11,12) with extra AR coatings. Blue points given values for the outer two rows without extra coatings (CCDs 1,2,3,4,12,14,15,16).
Above we show how the average zero points (ZP) and the median colour coefficients vary for the two sets of CCDs. The difference in colour response are clear. The outer (blue) CCDs exhibit less depth and a larger scatter in zero points due to vignetting of the outermost CCDs.
Reddening Effects in g-band:
Median g-band colour coefficients and field reddening values. Left: the full range of values. Right: the low extinction region.
As a comparison to the r-band, above I present those for ZTF g-band. This distribution of median colour coefficients does exhibit a slight trend with extinction. However, this is clearly a much smaller effect than r-band. This is to be expected since the small colour coefficients themselves suggest that the ZTF and PS1 g-band filters are much more similar than the r-band filters are.
The Spatial Distribution of Colour Coefficients
Considering that the r-band colour coefficients are a strong function of reddening it is expected that they will also be a strong function of Galactic latitude.
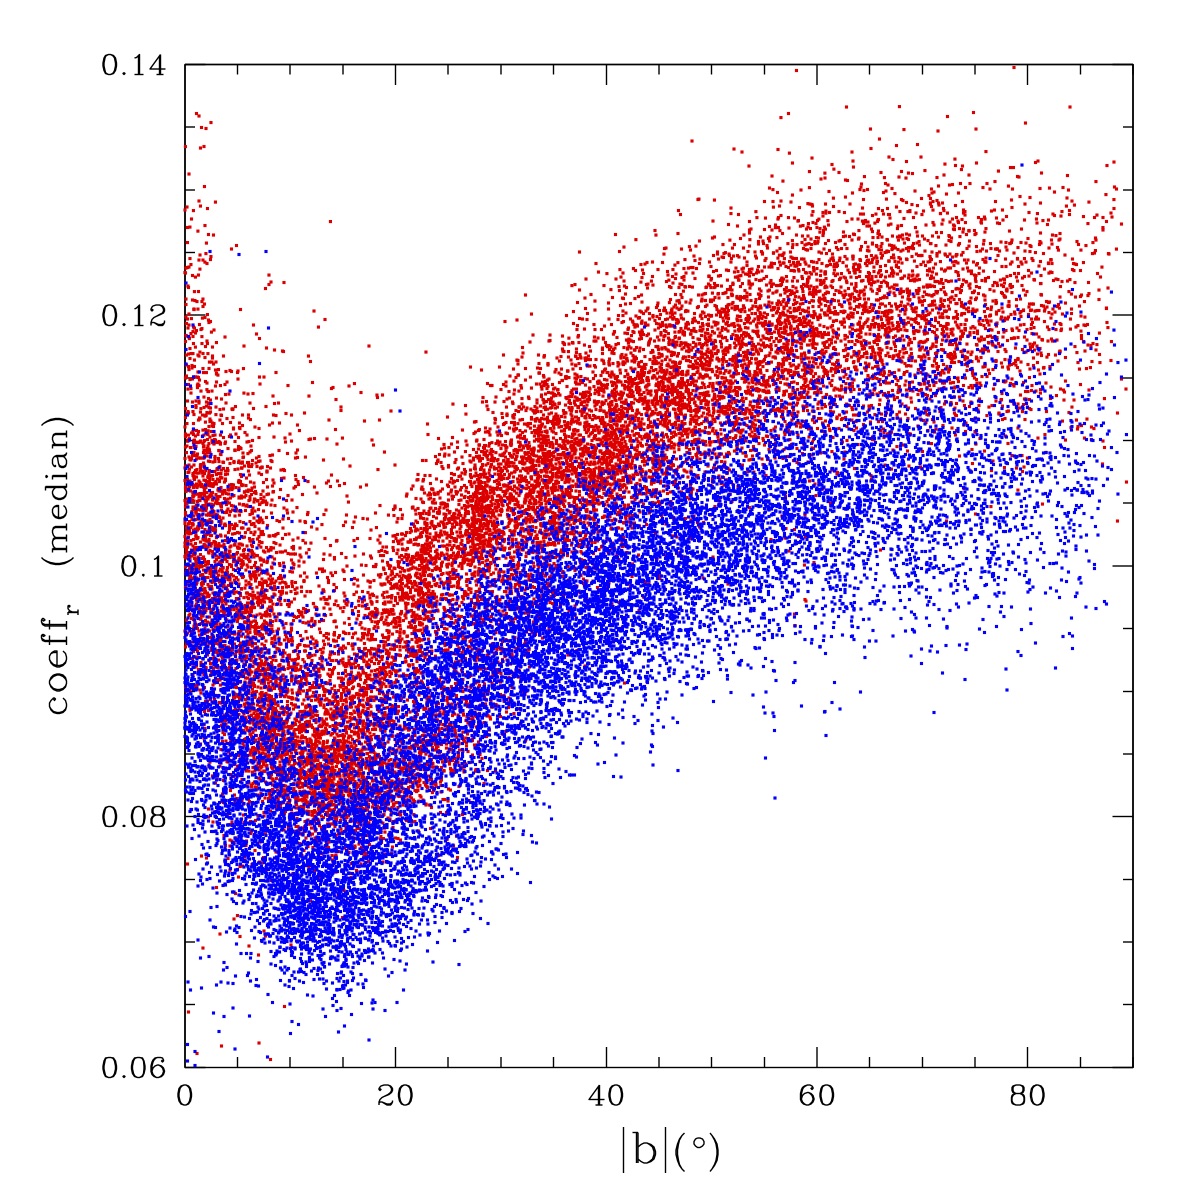
Median r-band colour coefficients vs the absolute Galactic latitude of each quadrant. Red points given the inner two CCDs rows (CCDs 5,6,7,8,9,10,11,12) with extra AR coatings. Blue points given values for the outer two rows without extra coatings (CCDs 1,2,3,4,12,14,15,16).
When we plot the distribution of the colour coefficients (above) we see that indeed the distribution is as expected. That is, a strong variation with Galactic latitude due to reddening increasing toward the Galactic plane.
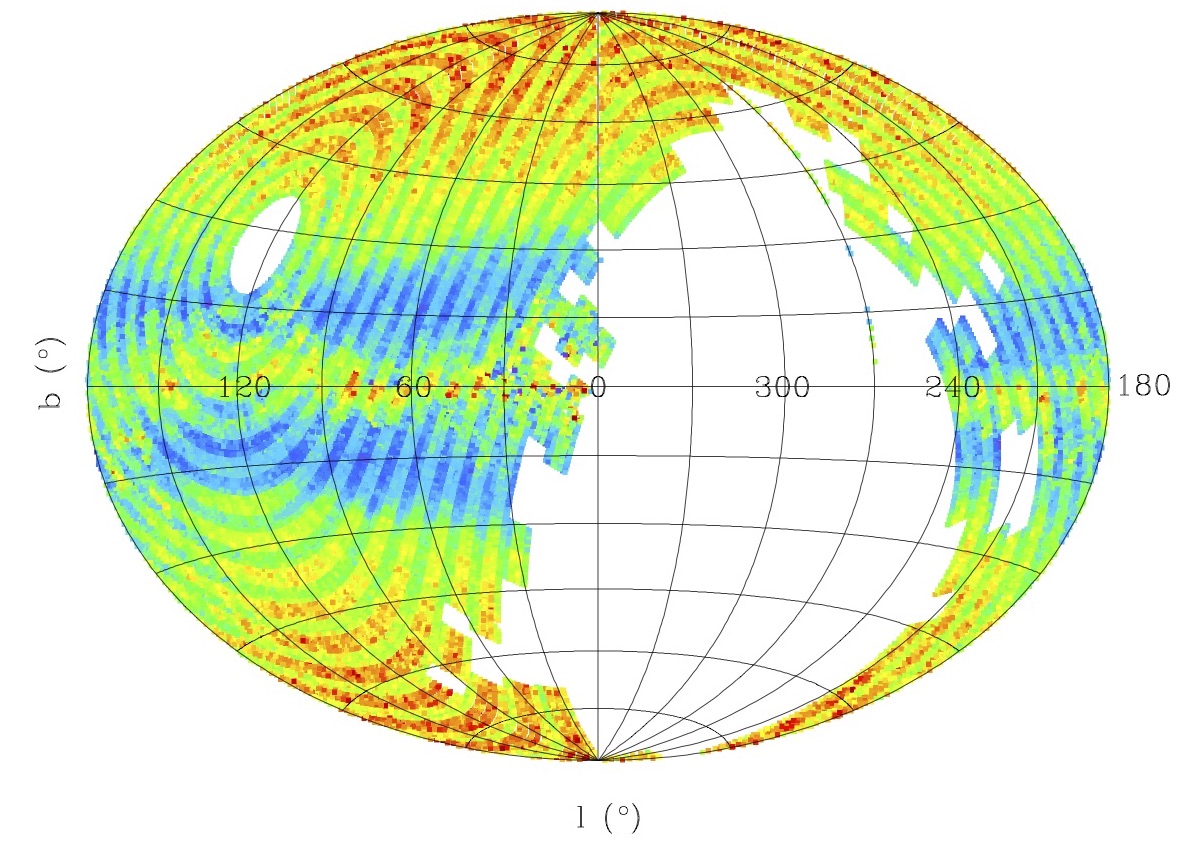
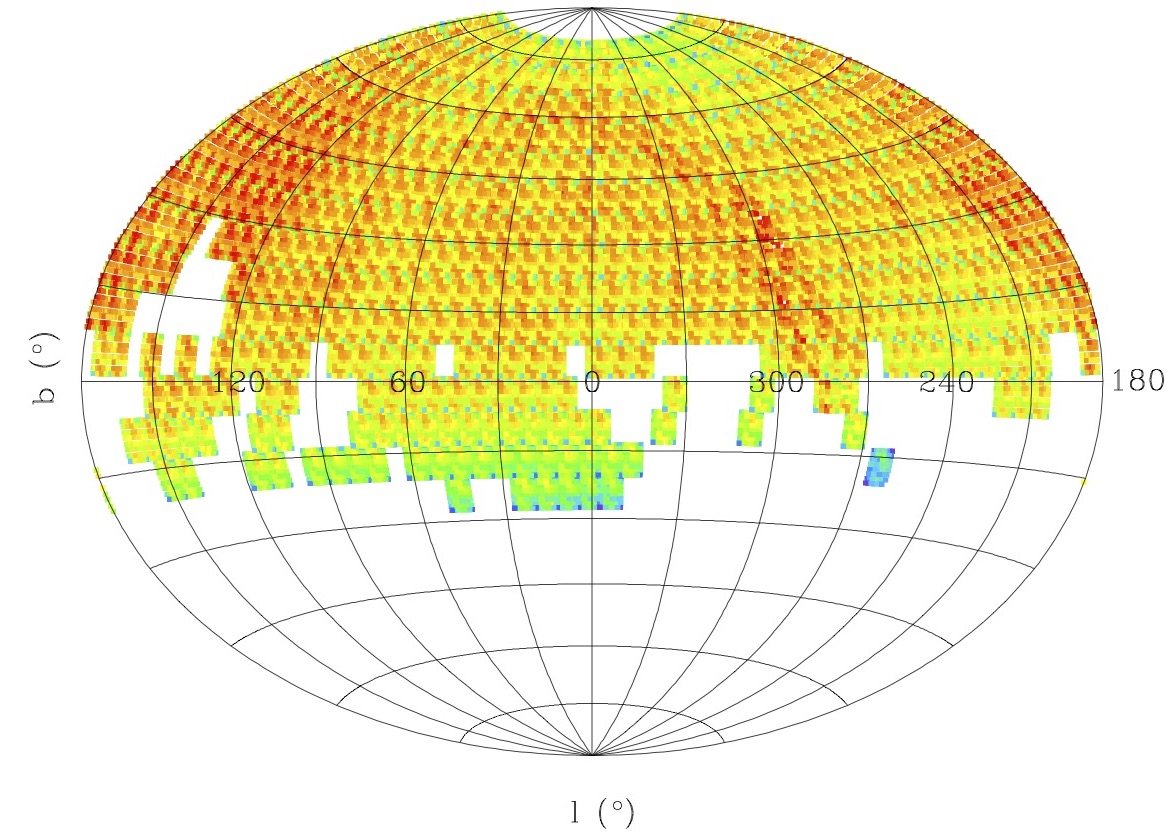
An Aitoff plot of the distribution of median r-band colour coefficients in Galactic coordinates. The colour coefficents range from 0.07 (blue) to 0.13 (red).
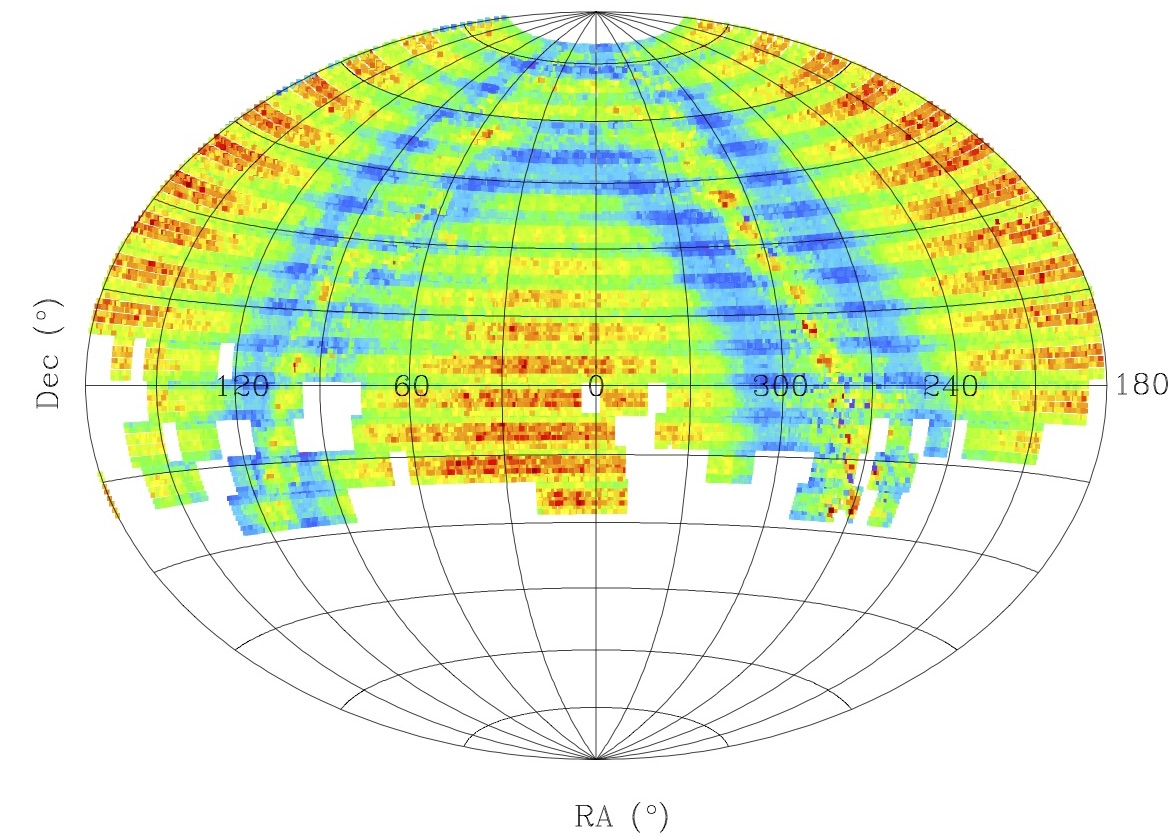
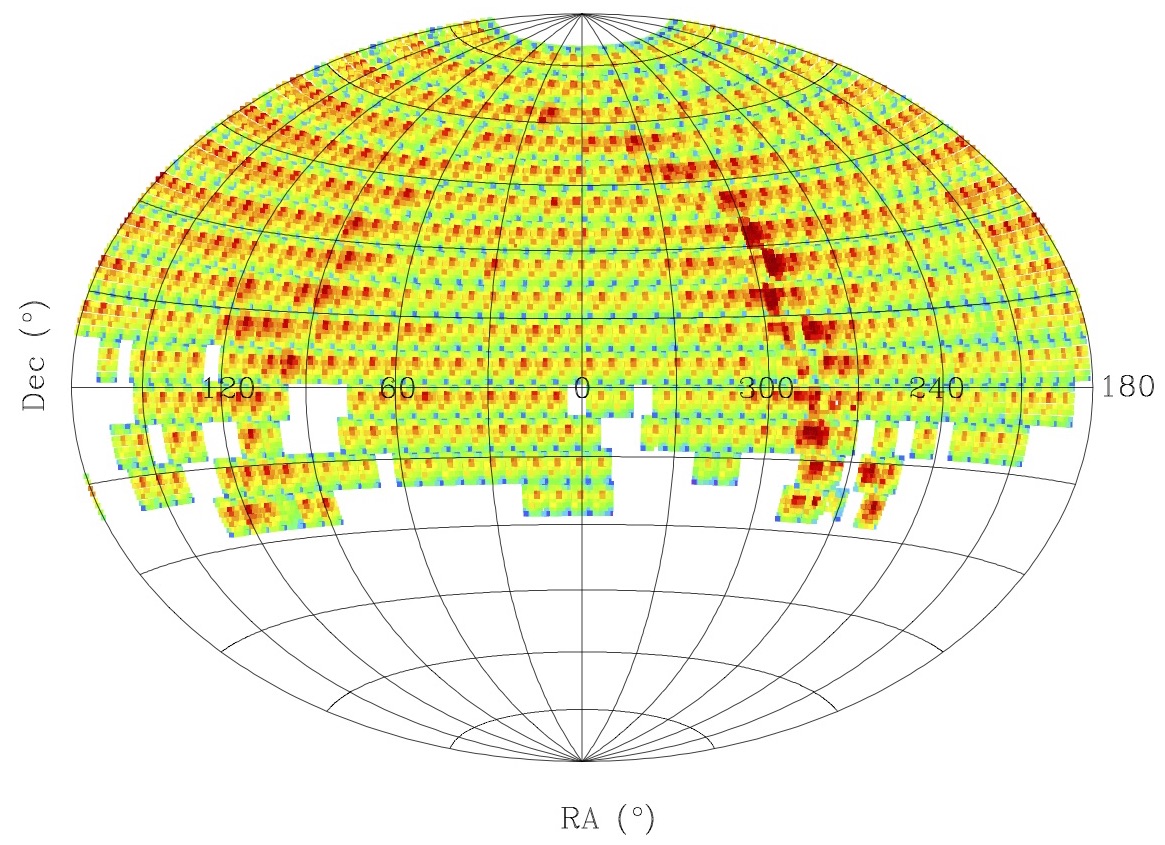
An Aitoff plots of the distribution of median r-band colour coefficients in Equatorial coords. The colours range from 0.07 (blue) to 0.13 (red).
When we plot the full spatial distribution for all fields we see the the domination effect of reddening. As expected, the regions of higher reddening are seen toward the Galactic center. We also see the clear division between the central CCDs and outer ones that create the stripes in the figures.
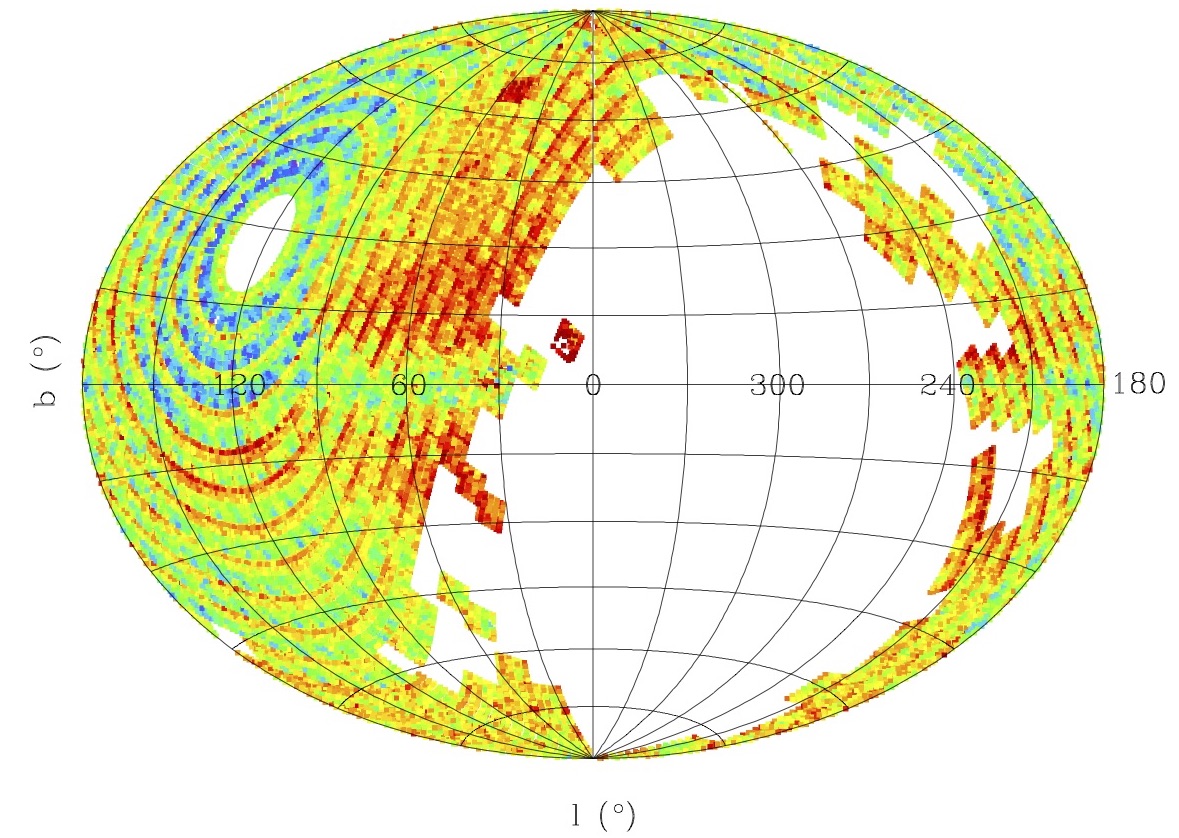
Aitoff plots of the distribution of median g-band colour coefficients. in Galactic coordinates. The colour coefficients range from -0.1 (blue) to -0.02 (red).
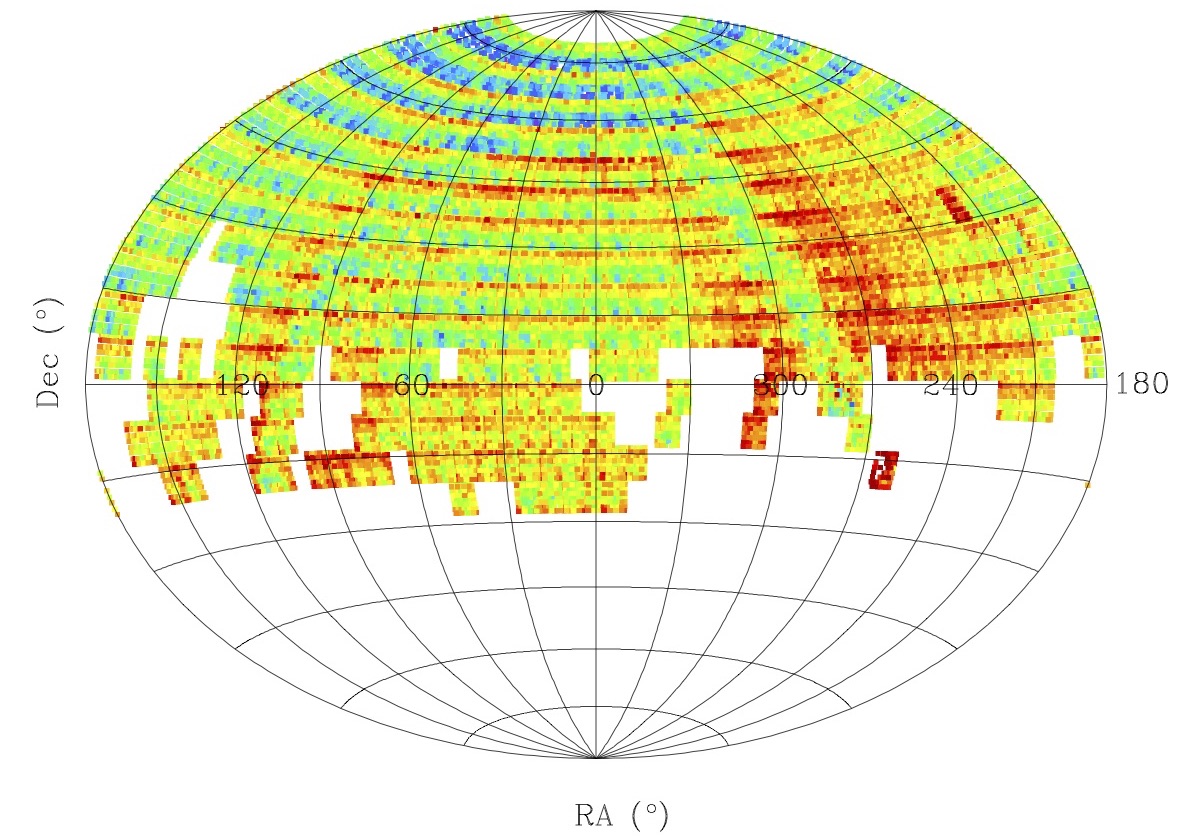
Aitoff plots of the distribution of median g-band colour coefficients in Equatorial coords. The colours range from -0.1 (blue) to -0.02 (red).
When we look at the colour coefficient distributions for g-band data we see only a very slight variation towards the Galactic plane. However, there is a strong variation with Declination as well as large areas with varying colour coefficients. These effects are likely due to combination of different average airmasses and seasonal weather, i.e. more clouds during winter. In addition, there is a clear effect within each field where the coefficents vary between the top of the camera and the bottom. This variation does not follow the r-band trend with AR coated CCDs. This appears to be related to airmass variations, but may also reflect some variations in the g-band filter transmission function with position.
Systematic Colour Coefficients of the Camera
From the figures above we see that there are systematic variations in the colour coefficients in the different camera quadrants (RCs). In order to quantify this we look and the distributions of values.
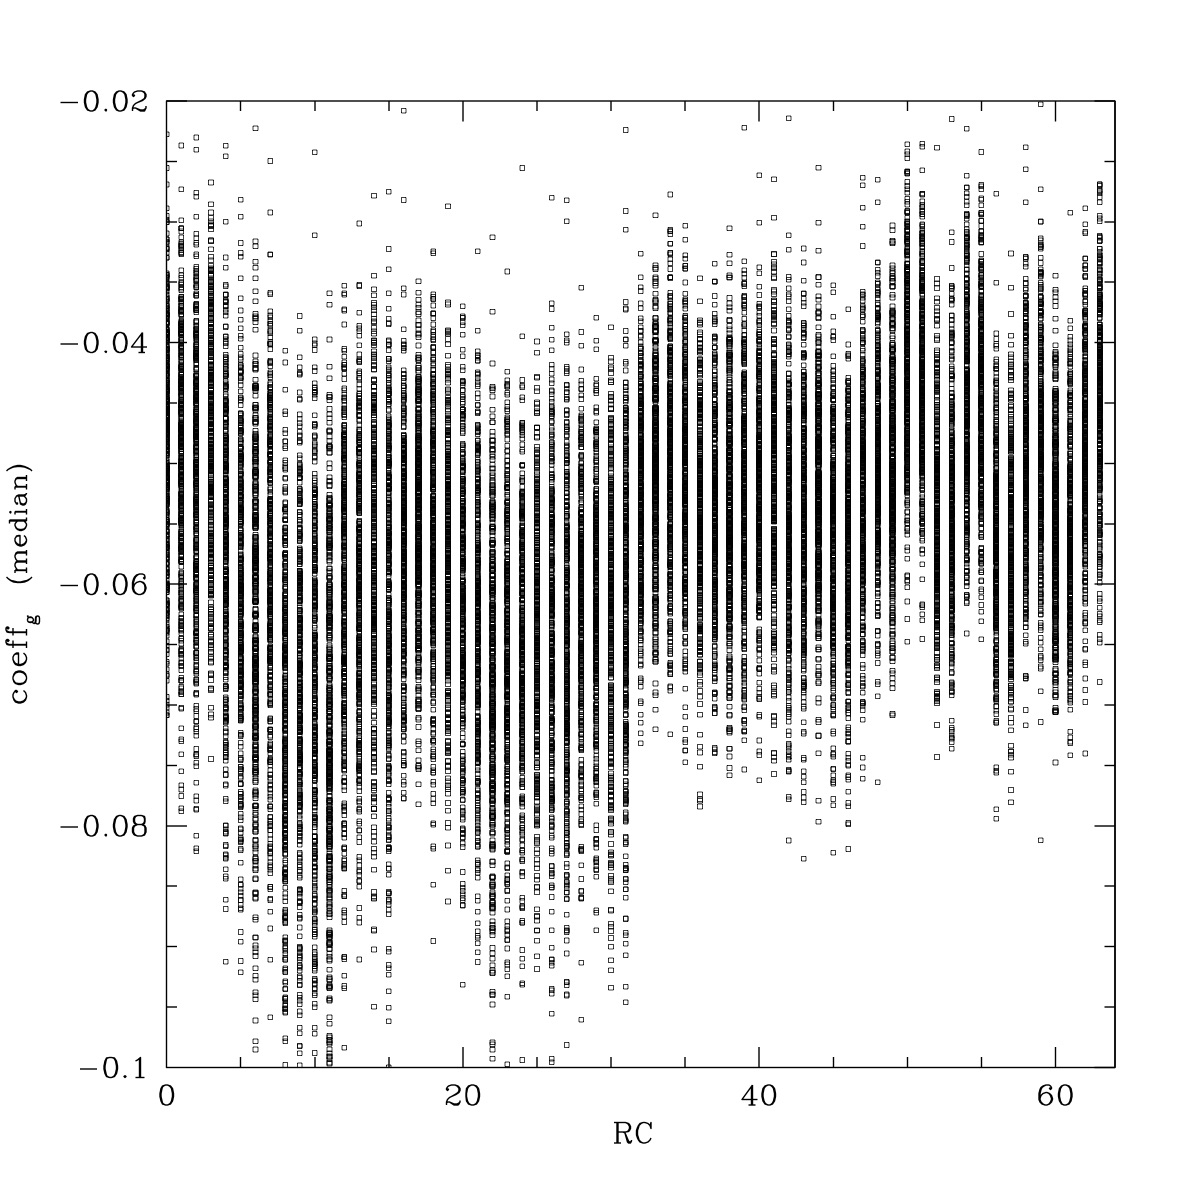
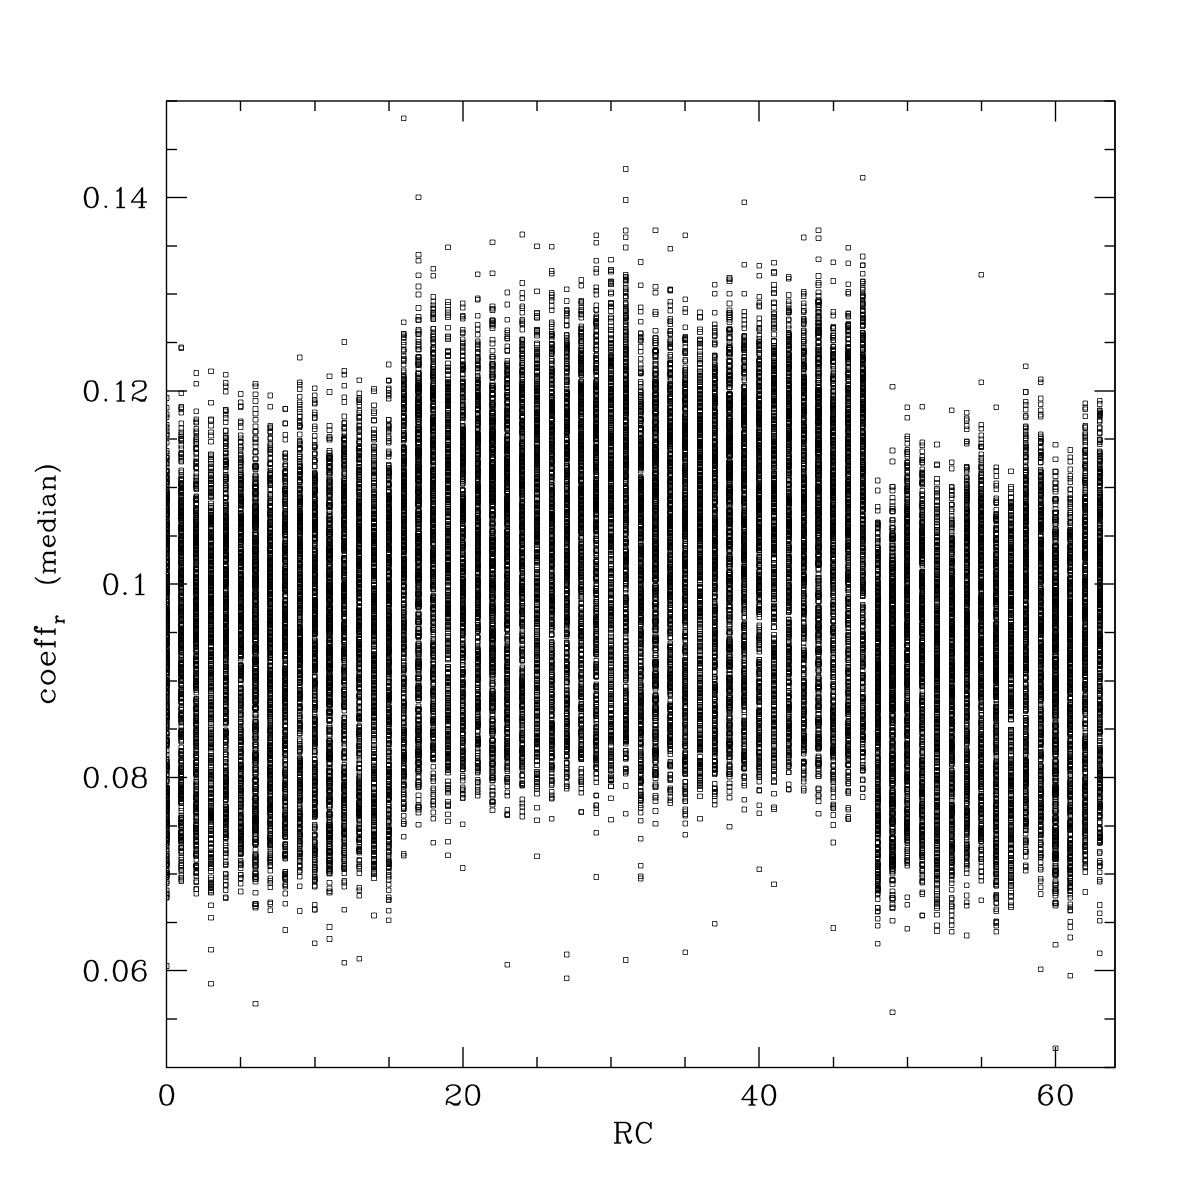
The median values colour coefficents for each quadrant (RC) for the ~500 fields considered. Left: the g-band coefficents. Right: the r-band coefficents.
In the figure above we see that there are clear systematic variations in the colour coefficients for different quadrants. In r-band the variations correspond to difference in AR coatings, as noted above, where quadrants in the middle of the camera are all offset from those on the edges. In g-band the source of the variations are more erratic and the cause is unclear.
To show this systematic nature more clearly I subtract the average colour coefficient from each entire field and average over each quadrant.
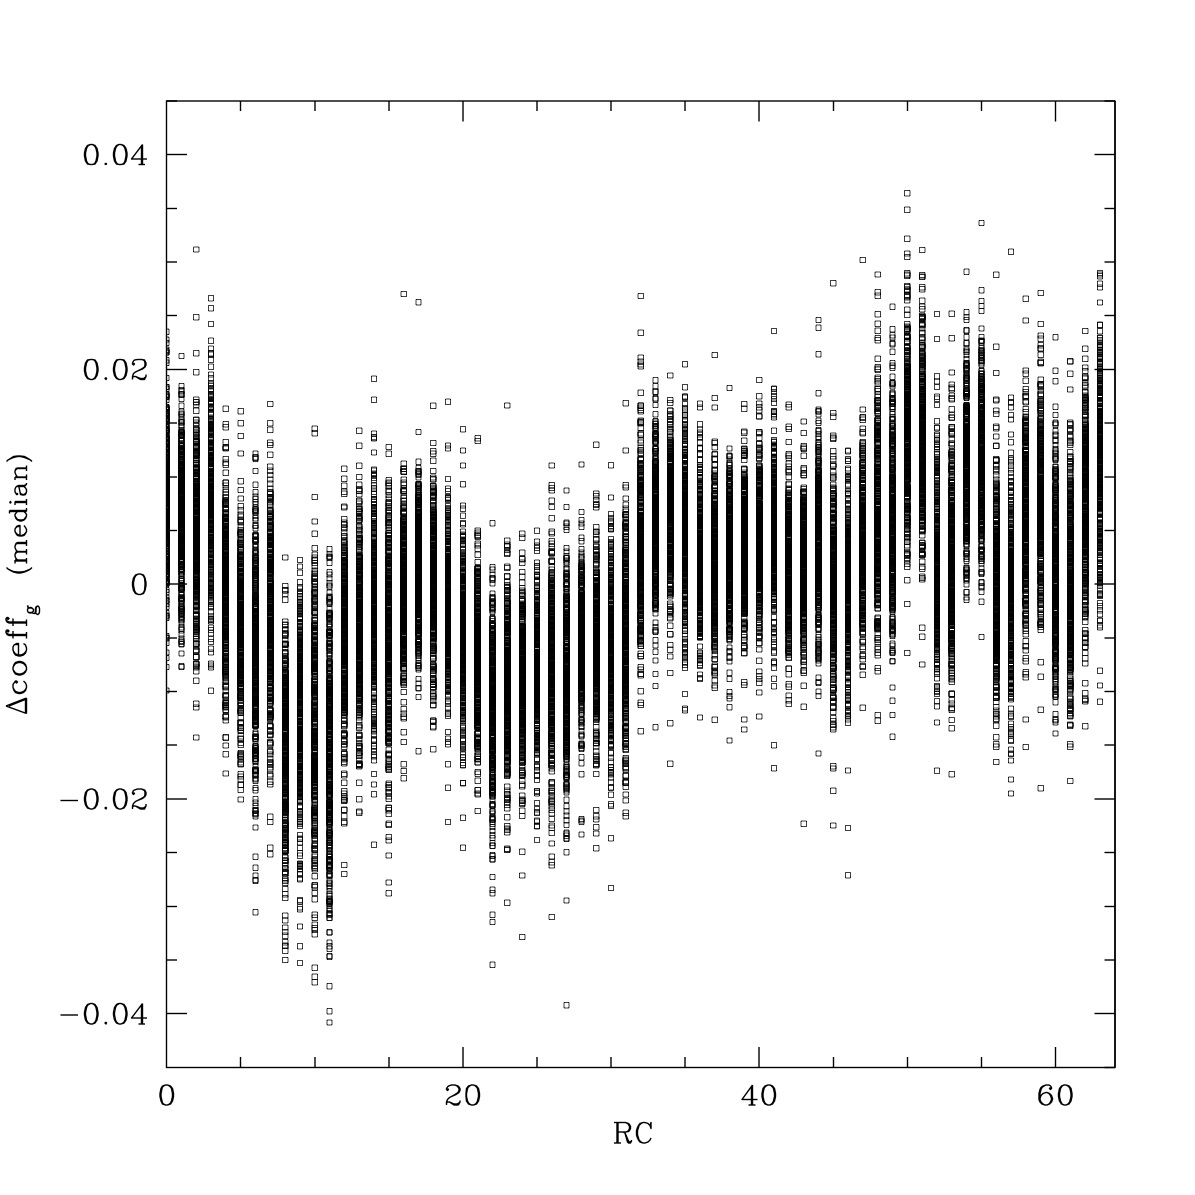
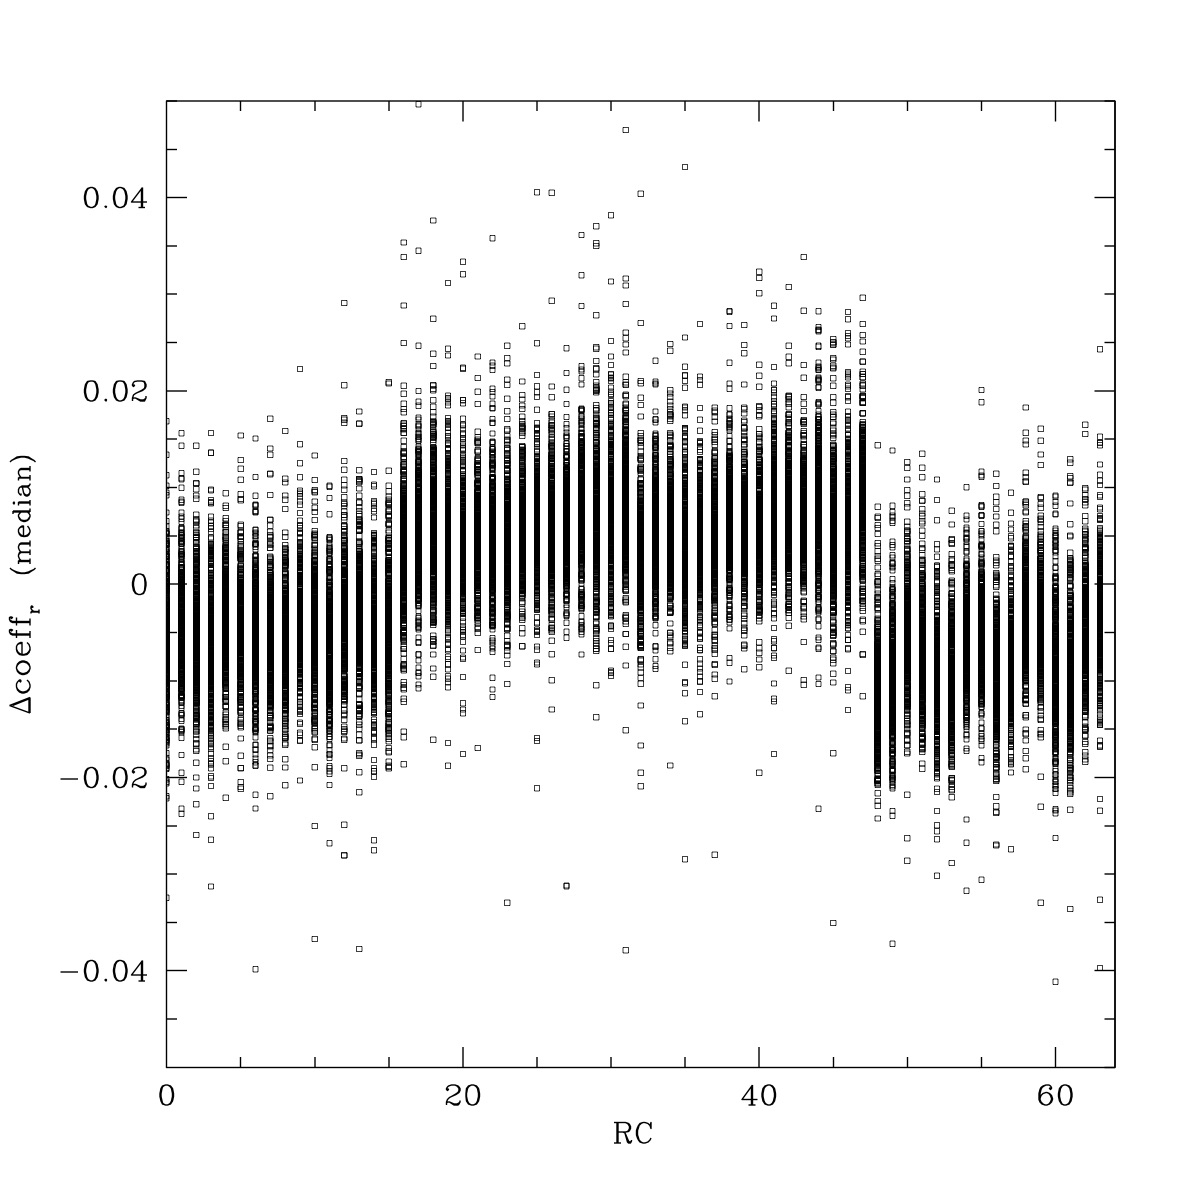
The field average subtracted colour coefficents for each quadrant for the ~500 fields considered. Left: the g-band coefficents. Right: the r-band coefficents.
After subtracting the field averages, both the g-band and r-band coefficents have a residual scatter of ~0.02. The r-band data shows little evidence of structure apart from the ~0.01 offset due to the AR coating. This suggests that the r-band colour response is very similar across all CCDs and the filter. On the otherhand, there are strong systematic variations in g-band (which are seen in Aitoff plots above). The systematic variation in average g-band colour coefficients is up to ~0.03 between different quadrants. This is very important to consider since it is half the amplitude of the colour term itself.
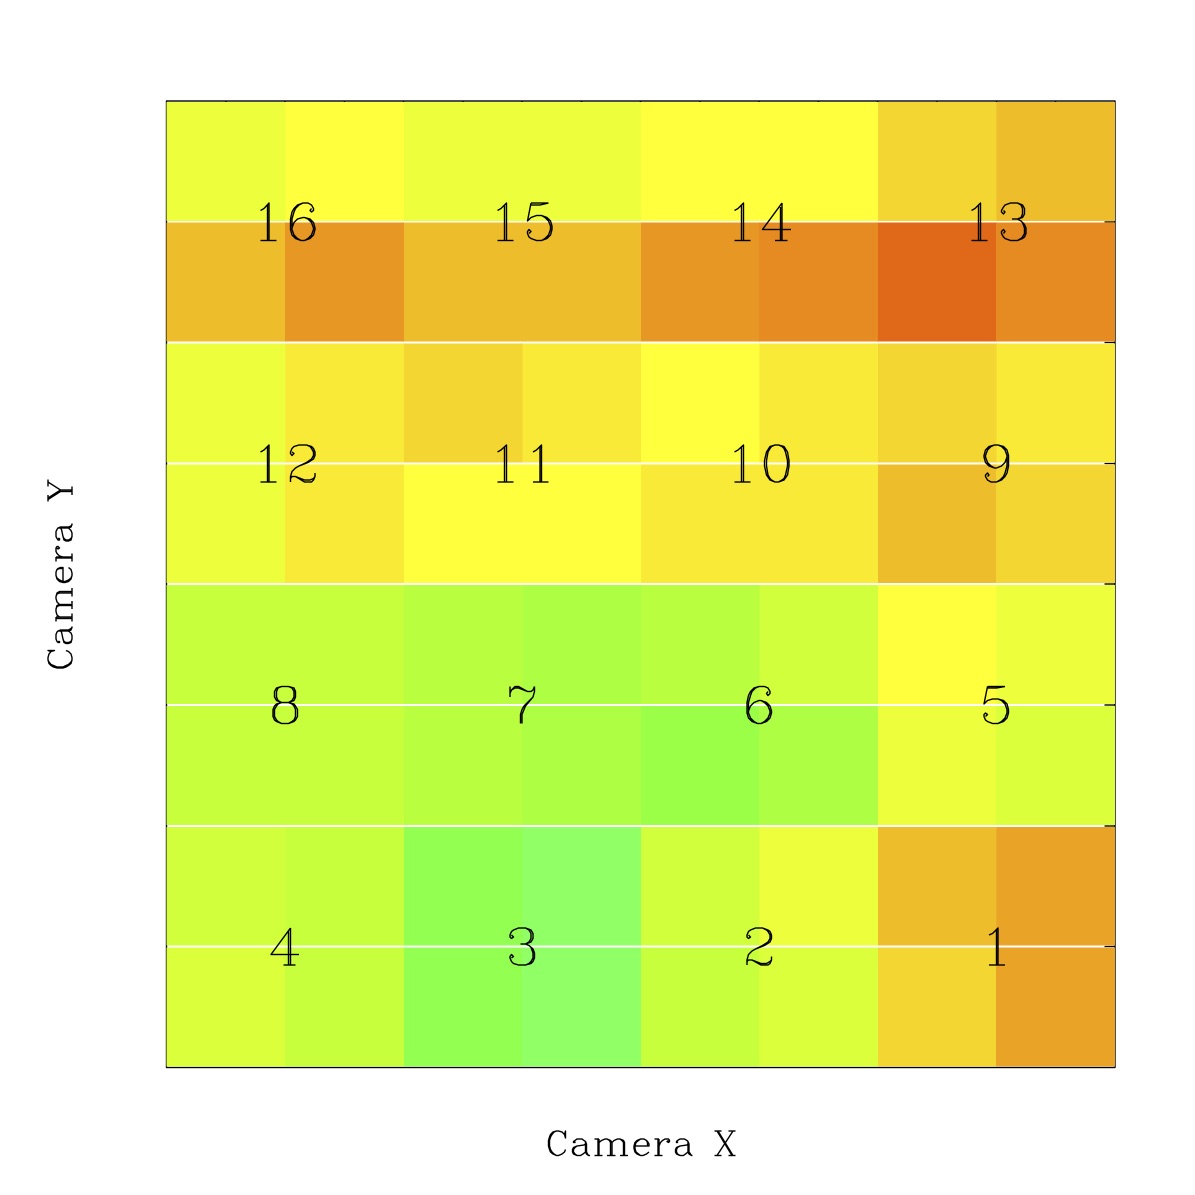
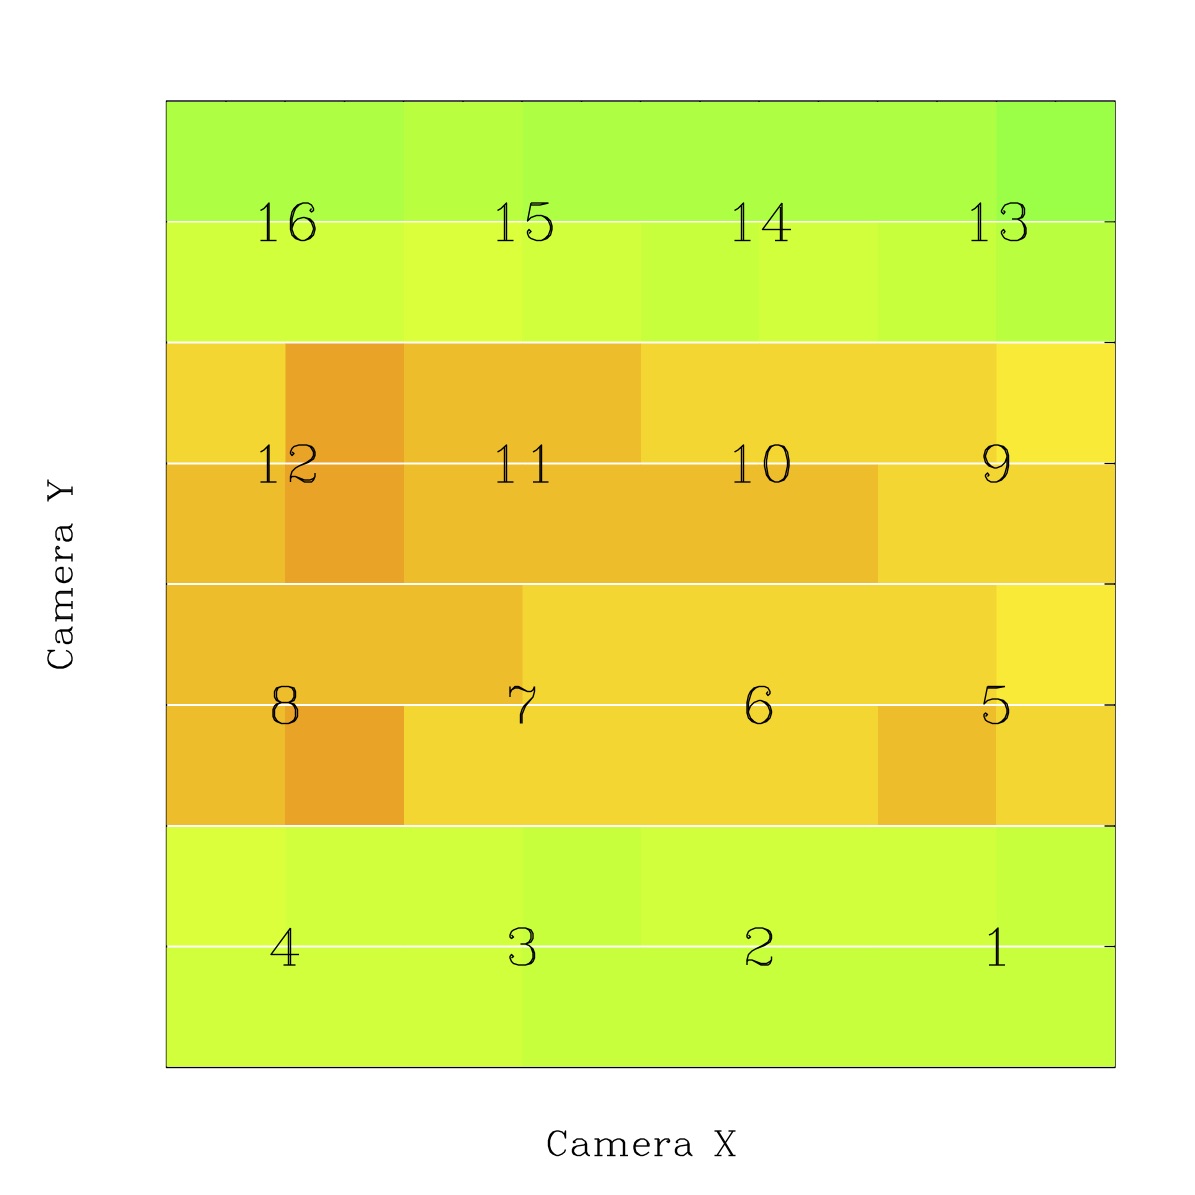
The average colour coefficient for each quadrant (readout channel) in the camera. Each CCD is numbered. Left: the g-band values. Right: the r-band values. The colours shown range from -0.014 to 0.014. See plots above for more quantitative results.
If we average over the range of values for each quadrant we arrive at the figure above where quadrants are arranged as they are in the camera itself. The reason for the g-band offsets between the quadrants within CCDs is currently unclear.
ZTF Zeropoint Systematics
Following the discovery of systematics from the analysis of colour coefficients it is worth considering the possibility of systematics in photometric zero points.
Equatorial coordinate Aitoff projections of the average zero points for each ZTF fields with nobs > 50. Left: g-band obs (colour range 25.9 < zp < 26.35). Right: r-band obs (colour range 26.08 < zp < 26.28).
The spatial distribution of average zero points above shows some significant systematics in both g-band and r-band. In particular, there are clear variations in ZTF r-band observations near the Galactic plane. Some of the this effect may be due to longer observations. However, ZTF r-band is redder than PS1, so ZTF reaches relatively more faint red stars in the Galactic plane than in higher Galactic latitude fields.
It is also likely that systematic errors in the colour coefficents (due to the variations between reddening PS1 and ZTF filters) introduce systematic errors in the calibration zero points. This explains why the peak r-band ZPs occur slightly away (~12 deg) from the Galactic plane where coeff_r ~0.09 and the extinction is E(B-V) ~0.08.
In g-band it is also clear the Southern declinations and far Northern fields are shallower. This is most likely due to the higher average airmasses of the observations in these fields.
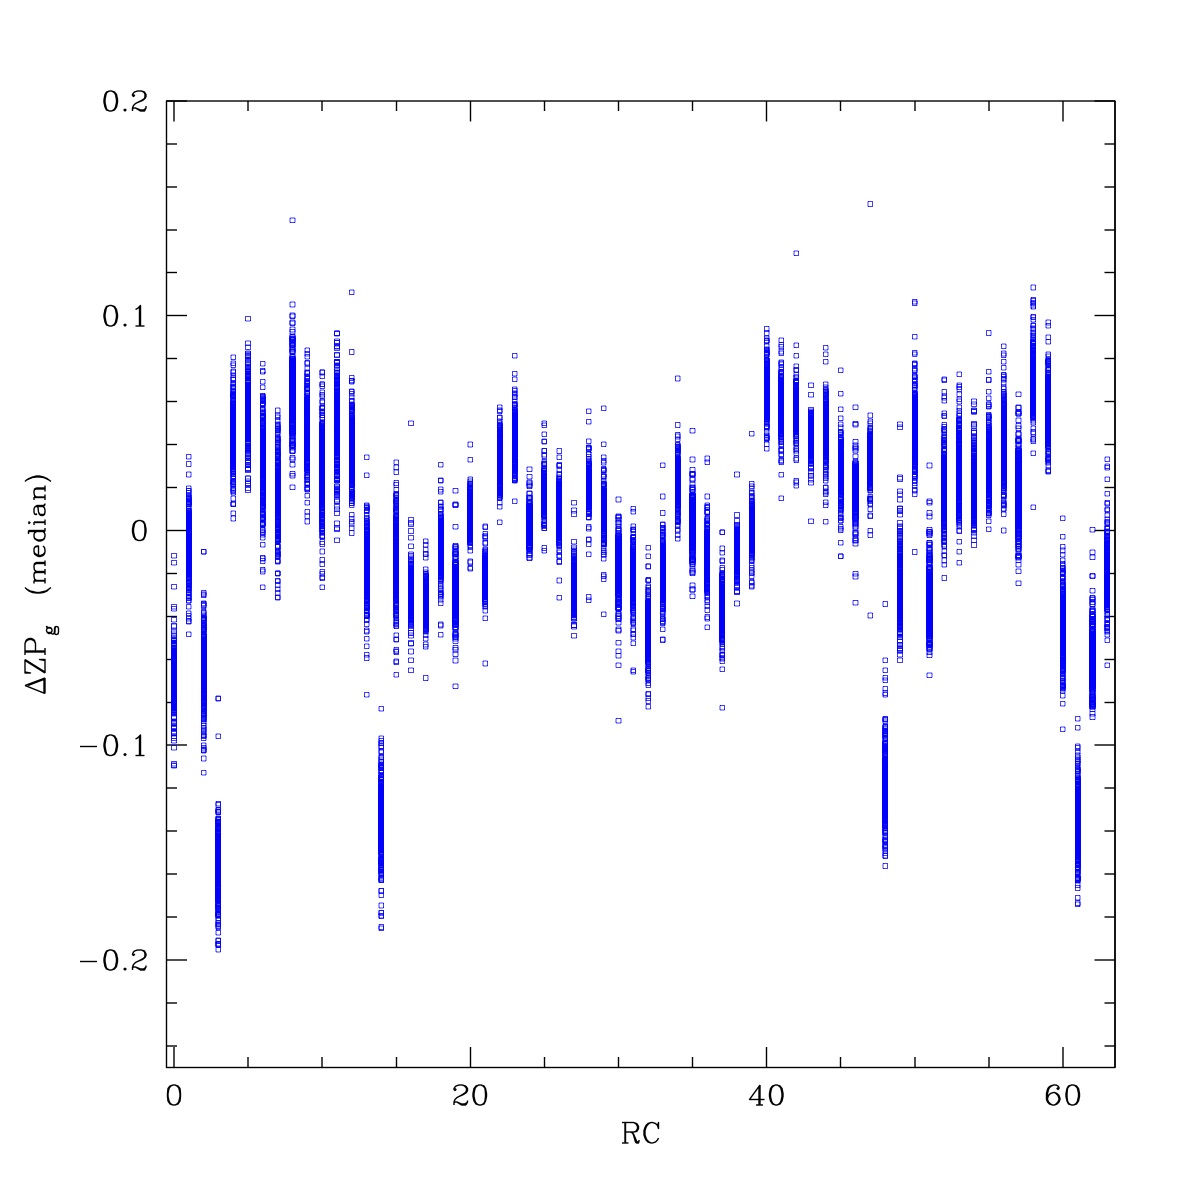
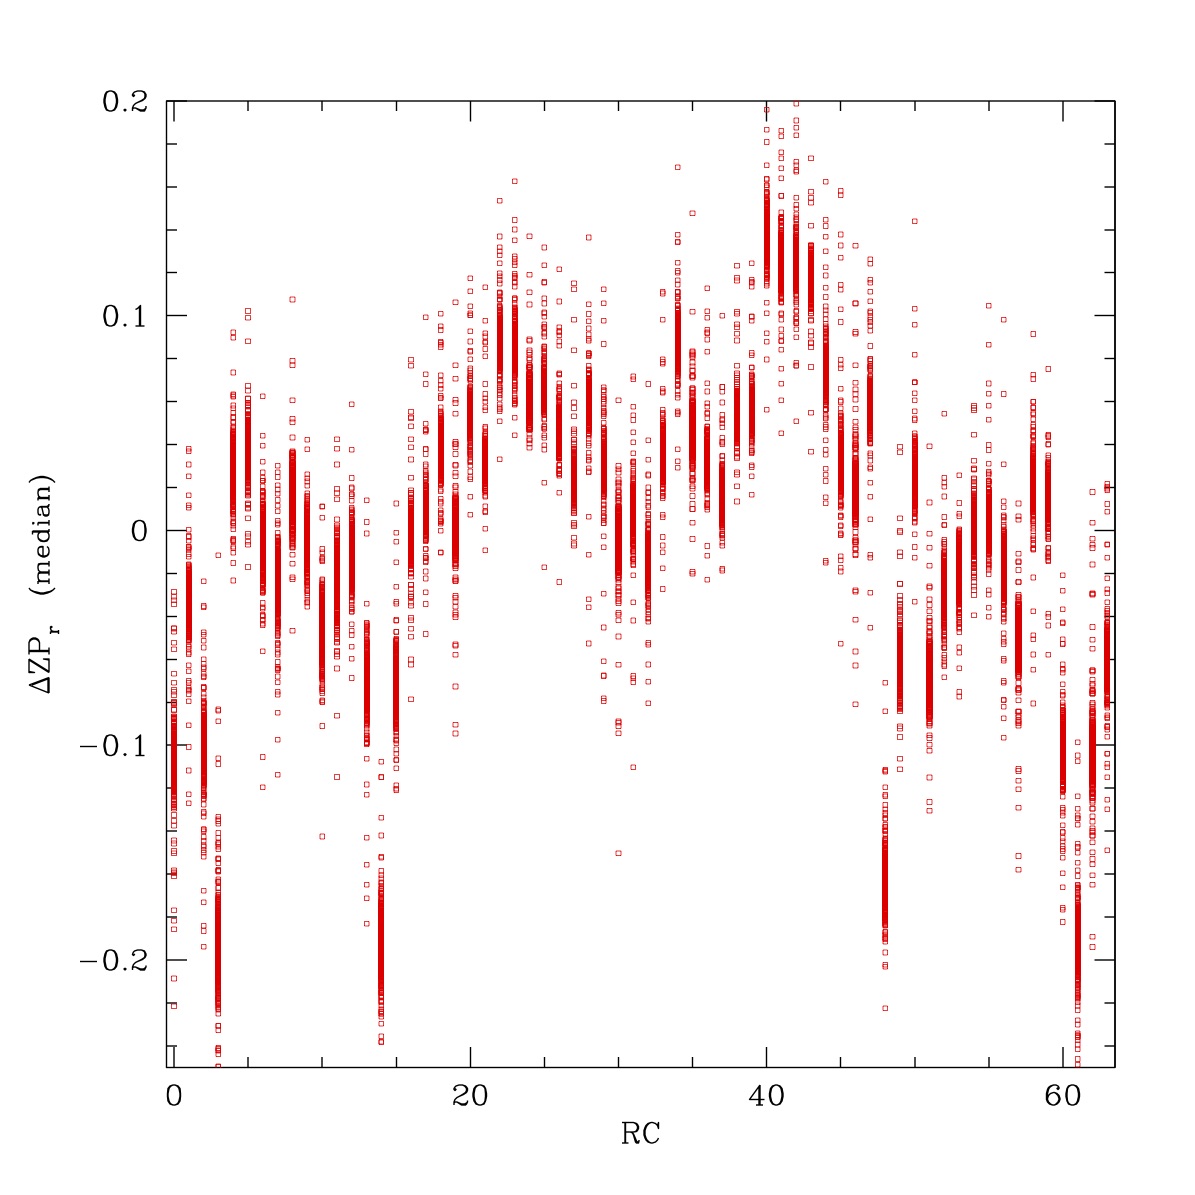
The distribution of field-average subtracted zero points for each quadrant (RC). Left: g-band obs. Right: r-band obs.
When subtract the average field ZPs from the data and plot the residual ZPs for the individual quadrants we see strong systematic variations across the camera in both g-band and r-band. These variations are clearly correlated between the two bands. The edges generally have lower ZPs due to vignetting. Overall, the r-band data appears to show a stronger decline in throughput with distance from the optical axis. To be specific, quadrant ZPs vary by up to ~0.2 mags in g-band and up to ~0.35 magnitudes in r-band. Differences in CCD AR coatings cause some of this variation, with the central CCDs being ~0.1 mags deeper when compared to the same CCDs in the g-band distribution. However, apart from vignetting, the reason for such strong variations between the quadrants within individual CCDs is unclear. This may relate to the noise level of the readout electronics.
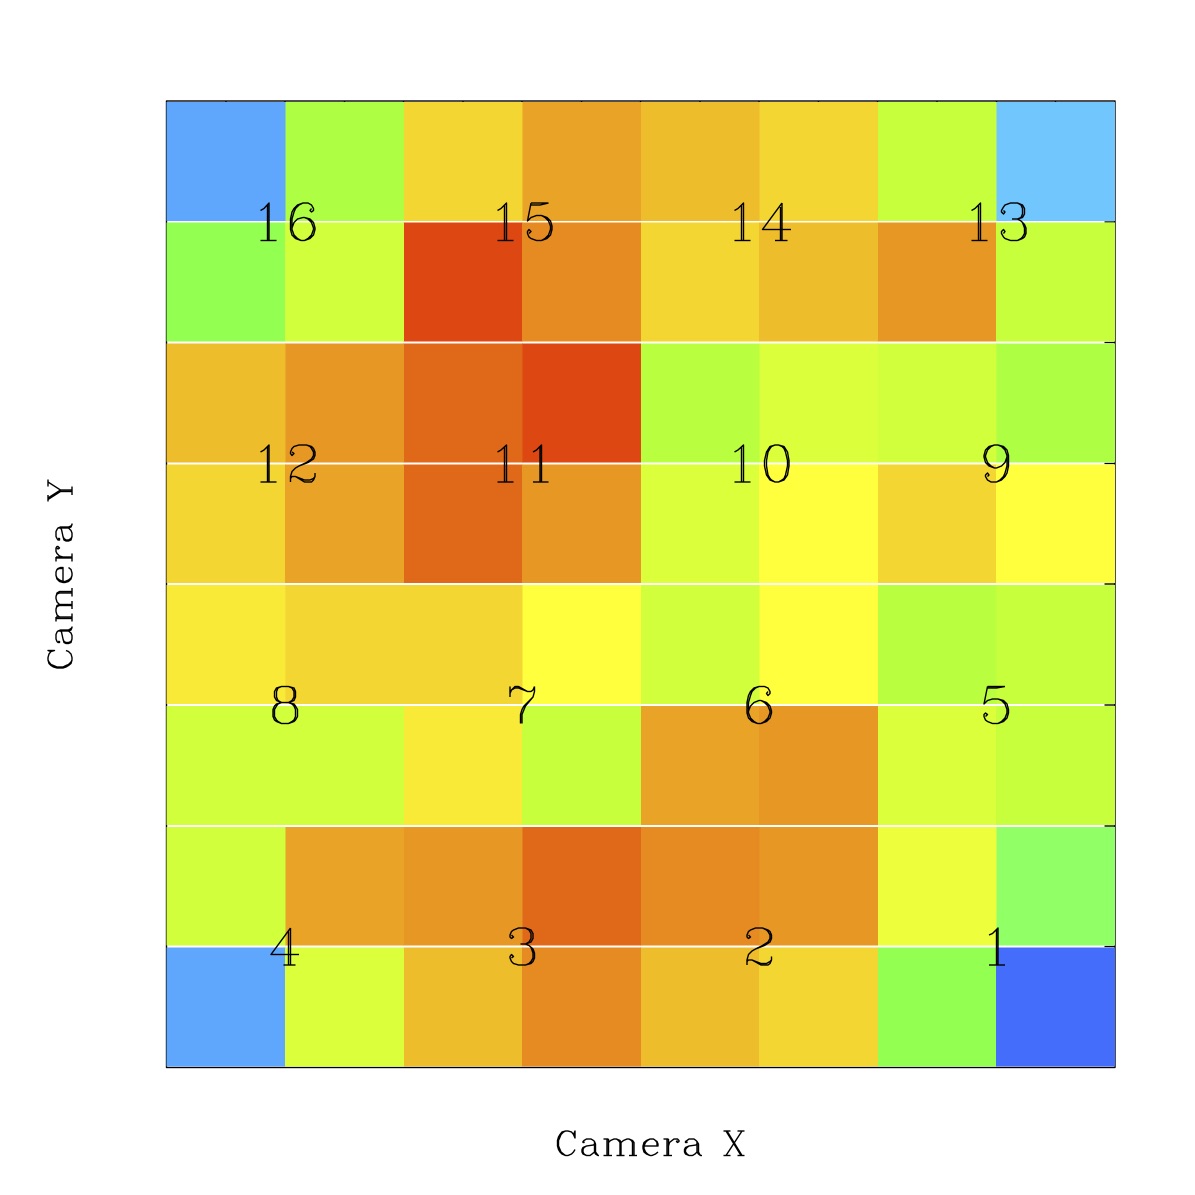
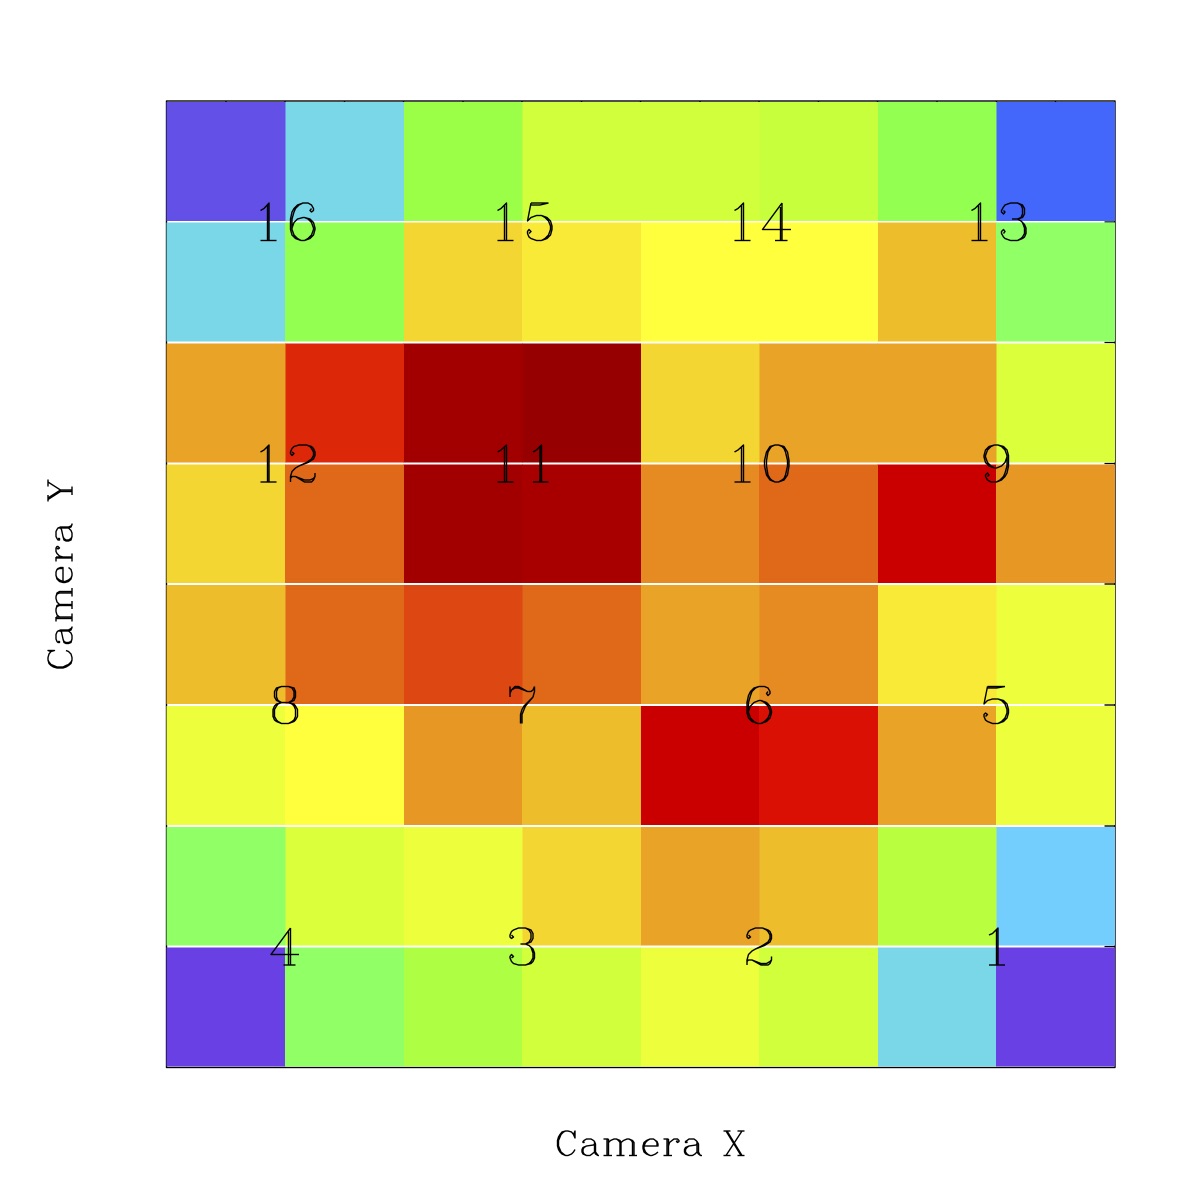
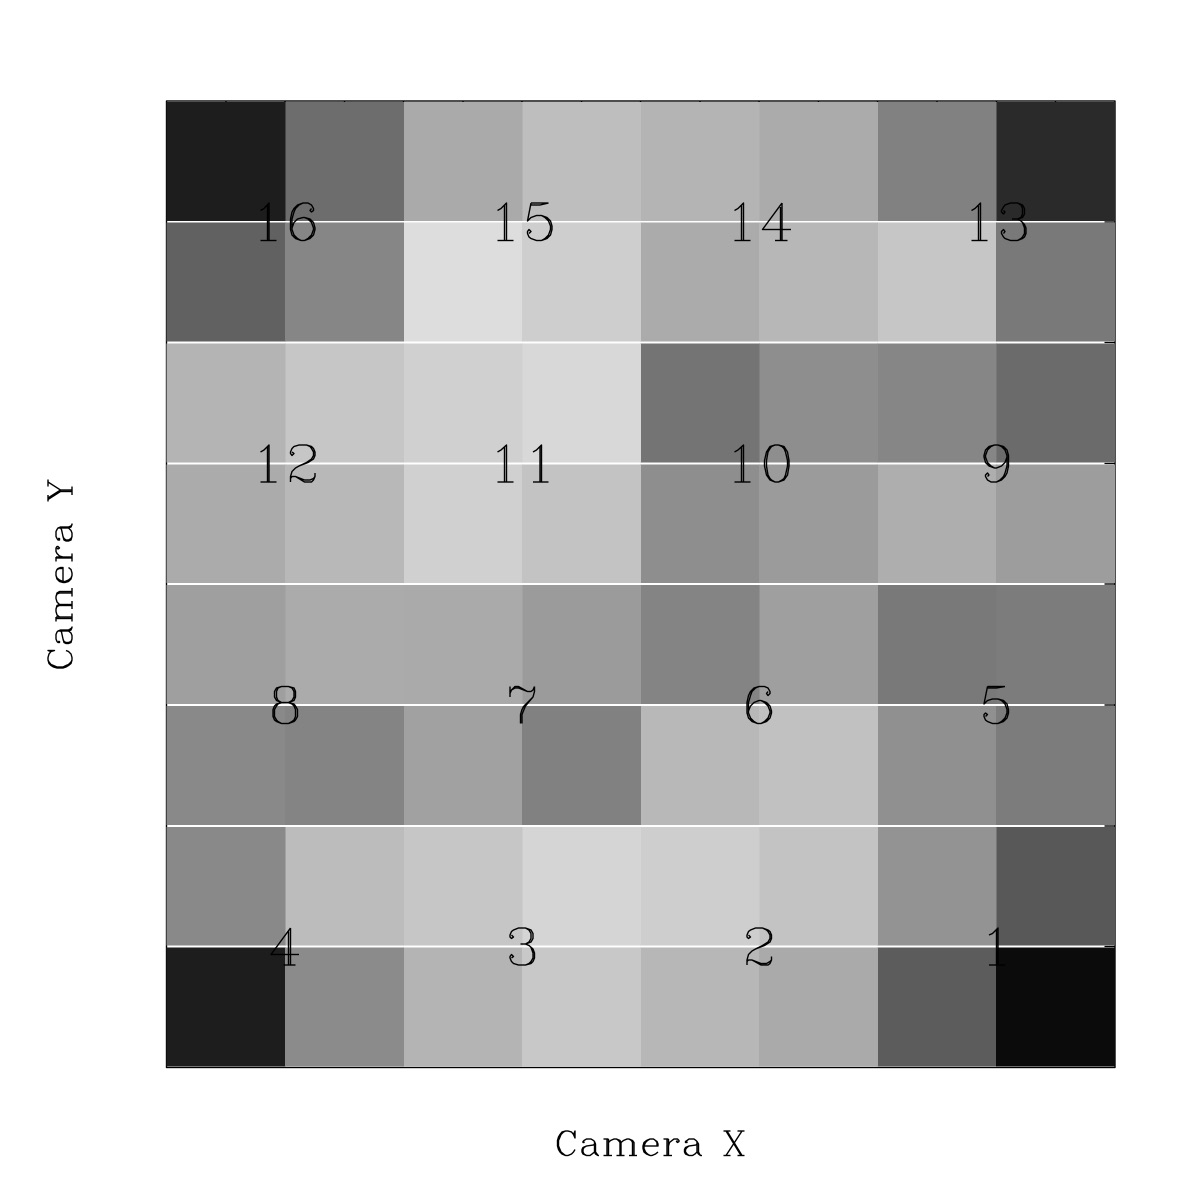
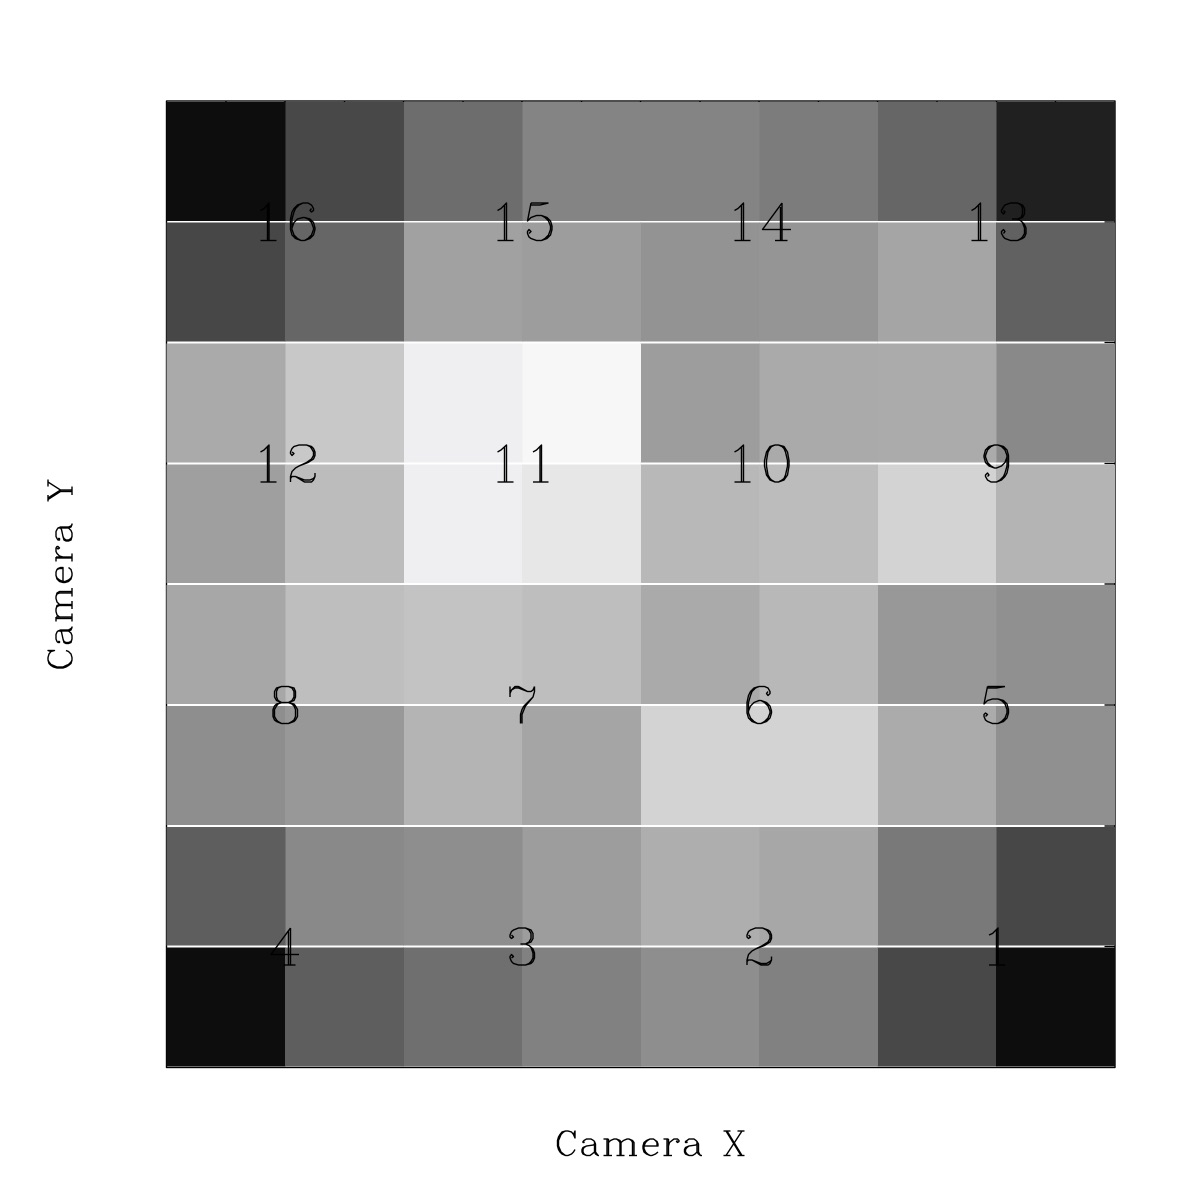
The ZTF camera based distribution of field-average subtracted zero points for each quadrant (RC). Numbers denote the CCD. Top Left: g-band obs. Top Right: r-band obs. Bottom Left: g-band obs (range -0.15 to 0.15). Bottom Right: r-band obs (range -0.2 to 0.2).
When we look at the variation in ZPs across the camera, we see that CCD 11 is generally deeper than other CCDs. This is not a new result. The increased depth in r-band is particularly noticable. In contrast, CCDs 7 and 10 performs more poorly in g-band. Here we have included a grayscale version since rainbow colours tend to over exaggerate slight differences. In r-band we more clearly see the expected decline on the edge CCDs (1,4,13,16).
Discussion:
Due to differences between ZTF and PS1 r-band filter transmission function and CCD QE there is a sigificant variation in the calibration colour coefficients with field reddening.
For sky areas where 0 < E(B-V) < 0.07 there is an approximately linear decrease in colour coefficients with increasing extinction. Beyond this range there appears to be a break and bifurcation (with an unknown cause). The distribution of coefficients then gradually increases in fields with higher values of reddening. In addition to the overall variations, there is a very clear division between the CCDs with and without an additional AR coating.
Given the significant variations in the colour coefficients with reddening, fields with low, yet patchy, reddening are expected to give rise to inaccurate colour coefficients that degrade their calibration to PS1. However, these variation can corrected by using a fit to the colour coefficent curve and the known reddening.
In fields with higher reddening, the variation in colour coefficients is much weaker. This suggests that patchy reddening in higher extinction fields (which is more common and extreme than in low extinction ones) will give rise to only slightly poorer calibrations than low extinction fields. The width of the distribution of colour coefficents (with a given CCD coating) at a given average extinction, suggests the range of colour coefficent variation due to patchy reddening. The true relationship between extinction and colour coefficients is probably much tighter since other effects, such as QE variations between CCDs, would increase the scatter.
The r-band coefficcent show a possible break in colour coeff vs E(B-V) at ~ 0.08. This may be due to the groups of calibration stars being excluded from magnitude and colour selection regions used to select them. Another possibility is the variations between the low metalicity and extiction, Halo stars, and higher metalicity and extinction disk stars. Closer examination is required.
In contrast to r-band, in ZTF g-band there is only very slight trends median colour coefficient with field reddening, and there is no clear division between the CCDs with and without an additional layers of AR coating. This is a somewhat surprising result given that extinction has a much larger effect in g-band than r-band. However, the g-band coefficents exhibit strong effects with RA and Dec that likely reflect variations in the average airmass and weather conditions. Additionally, there are strong variation in the g-band coefficents across the focal plane. These amount to up to half of the observed colour coefficient. This suggests that in g-band, colour coefficients are required on quadrant level to account for differences between ZTF and PS1 reddening and airmass extinction. In r-band there is simply an offset between the central and outer CCDs.
The average g-band ZPs within fields vary with sky position. The is expected due to average weather (cloud cover) and airmass variations. In r-band the variation is more closely related to Galactic latitude and hence reddening. When ZP field variations are removed, we see that the camera quadrants exhibit strong systematic effects. Although the overall trend is explained by vignetting and AR coating differences, individual CCDs such 7,10 and 11 exhibit offsets suggesting varying CCD QE. Variations are also seen between quadrants within the same CCD, possibly suggesting differences in the readout noise levels.
The variations in the ZPs internal to quadrants are expected to be up to ~0.05 mags based on the difference in average ZPs of adjecent quadrants. The flux variation should be corrected by gradients in the flatfields. However, the presence of some residual gradients is consistent with the structure in the photometric residuals.