| Topics |
|---|
| Colour dependent Residuals. |
| Colour trends in other fields. |
| Conclusions for colour residuals. |
| Residual trends with PSF shape. |
| Conclusions about current state of residuals. |
Colour dependent photometric residuals
Investigations into removing photometric outliers based on PSF fit chi values led the discovery of trends in photometric residuals with source colour.Starting by matching calibrated and corrected (for mag bias, spatial structure, and field offset) ZTF g and r-band photometry to PS1 (after removing galaxies), I investigate a number of fields for residual photometric trends.
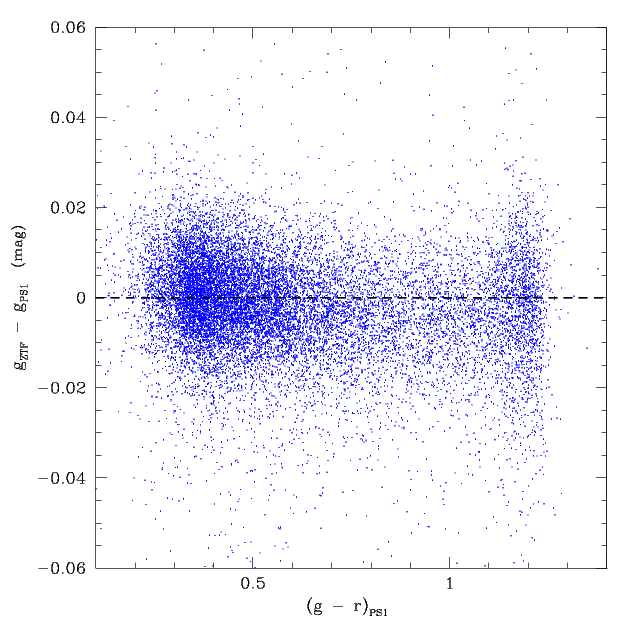
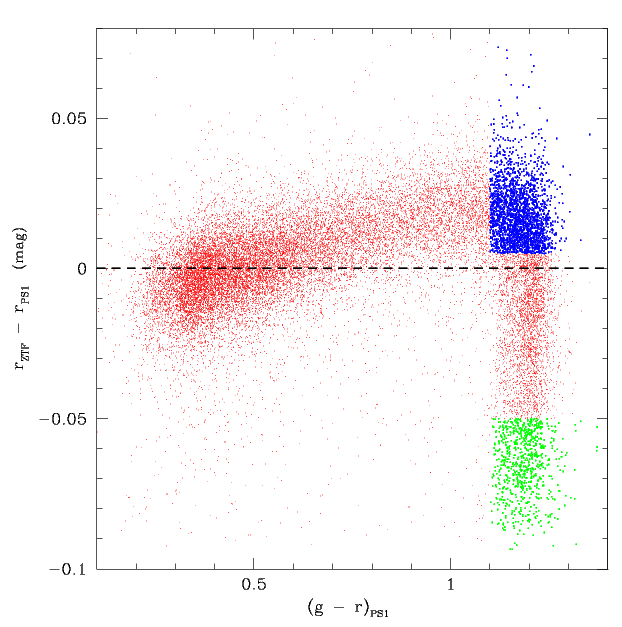
Average photometric residuals for all sources 13.5 < mag < 18 in ZTF Field 297 vs PS1 colour. This data is calibrated to PS1. Left: the g-band residual dependence. Right: The r-band dependence. Blue and green regions were selected for further examination.
In the figure above we see that there is only moderate structure in the g-band residuals with g-r colour, but strong structure in the r-band. This strongly suggests that additional colour corrections are required to better calibrate ZTF PSF photometry.. The source is likely the difference between PS1 and ZTF colour response (which creates second order effects with airmass, reddening, etc.)
For the r-band we see that there is a systematic dog leg of residuals around g-r = 1.2. We mark and select the two groups of stars with similar colours, but very different systematic residuals, for further study.
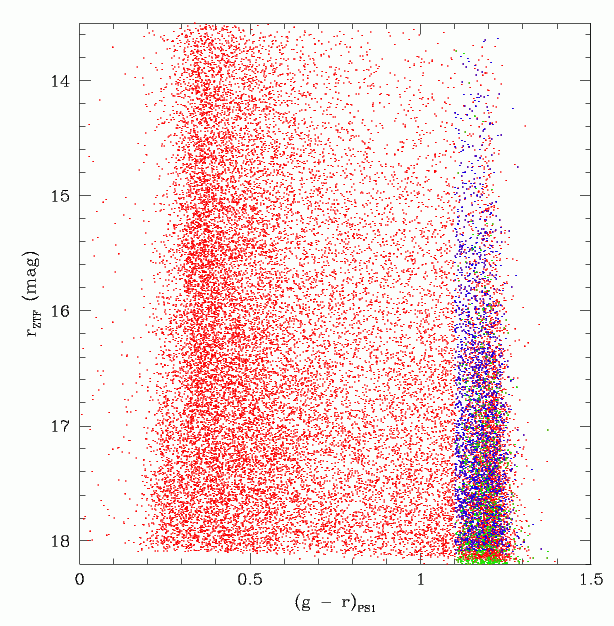
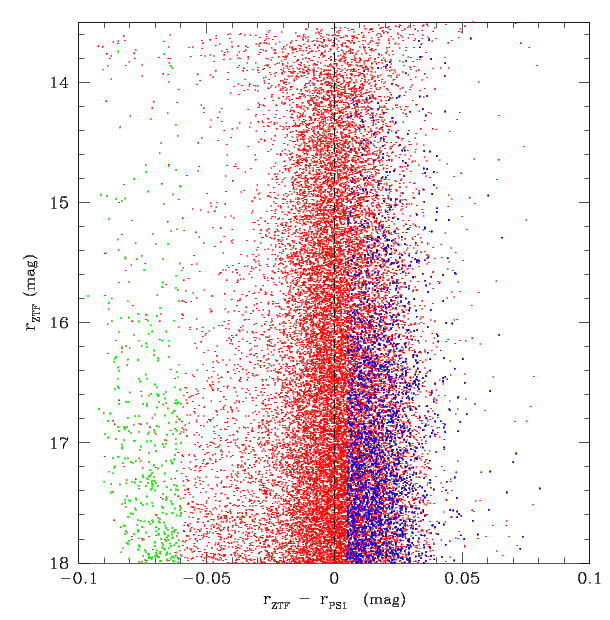
The CMD and brightness dependency of residuals for sources in field 297. Left: CMD with blue and green points correspond to regions with very different systematic residuals. Right: The r-band residuals as a function of brightness.
In the figure above we see that the blue points (with positive g_ztf - g_ps1 systematic residuals), are distributed over a spread of magnitudes while the green points (with strongly negative residuals) are generally faint source which form a discrete feature in the CMD. The second plot shows that the residuals are not very dependent on the source brightness in this field.
To better determine the nature of these two groups stars I matched all the bright source (13.5 < mag < 18) in ZTF field 297 to Gaia DR2. This gives us accurate distances, proper motions and additional colours.
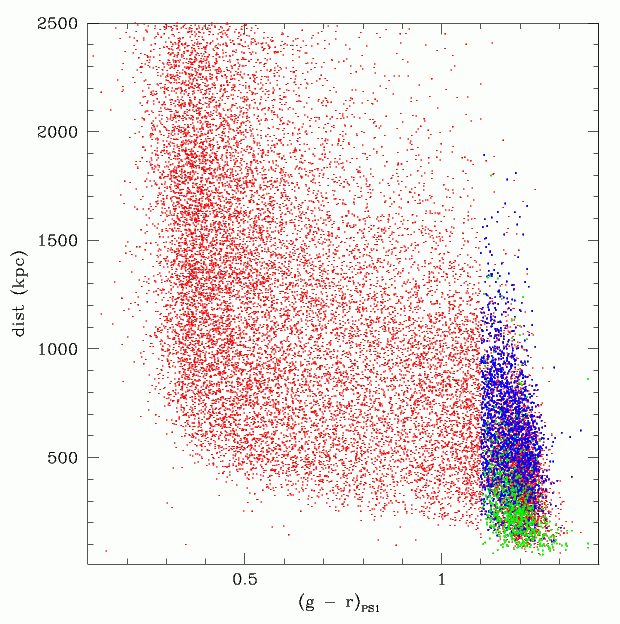
The Gaia distances of bright sources in ZTF field 297 vs their PS1 colours.
From the figure above we see that the green sources are very nearby. Field 297 has a central Galactic latitude b=-75 degrees. Thus, the green points show the foreground disk M-dwarf stars, while the blue points are thick disk and red points are in fact blue thick disk and halo stars.
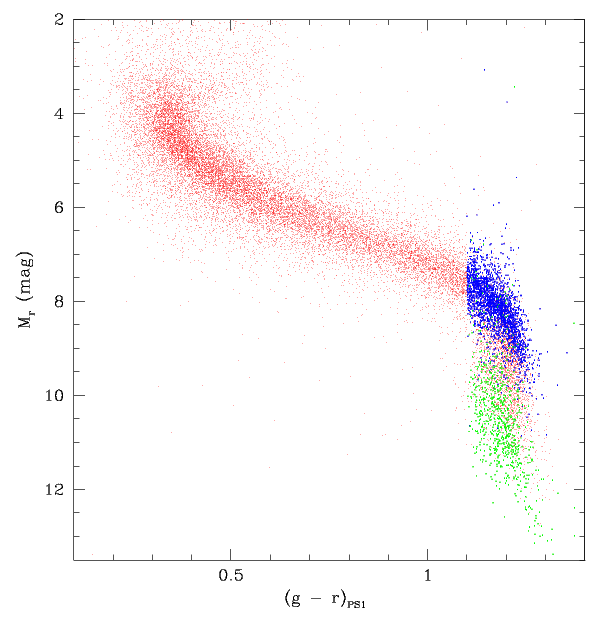
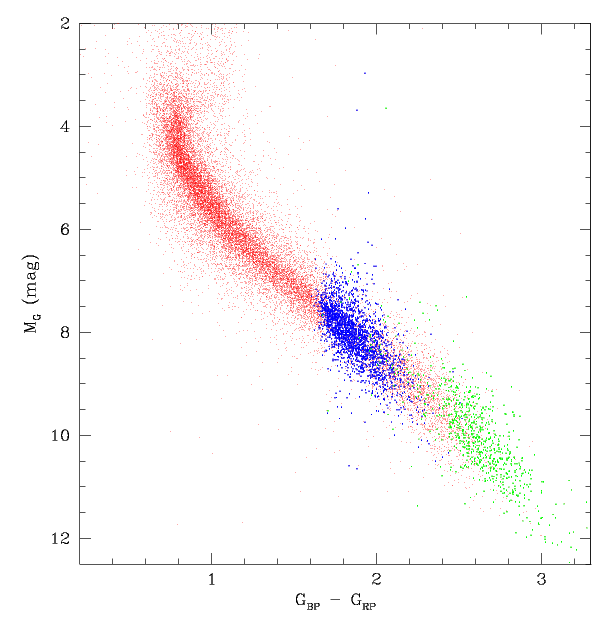
Absolute magnitudes for bright sources in Field 297 based on Gaia distances. Left: Absolute magnitudes in PS1 colours. Right: Absolute mags based on Gaia photometry.
In the figure above we plot the absolute mags using PS1 and Gaia photometry for the stars in ZTF field 297. The PS1 data shows us that the blue points and green have significantly different absolute magnitudes. The Gaia photometry shows us that these two groups of sources actually have very different colours, yet the PS1 (g - r) colours are unable to distinguish foreground late M-dwarfs from early M-dwarfs in the thick disk. This suggests that additional colours (such as PS1 i-band), are needed to properly calibrate red ZTF stars as shown below.
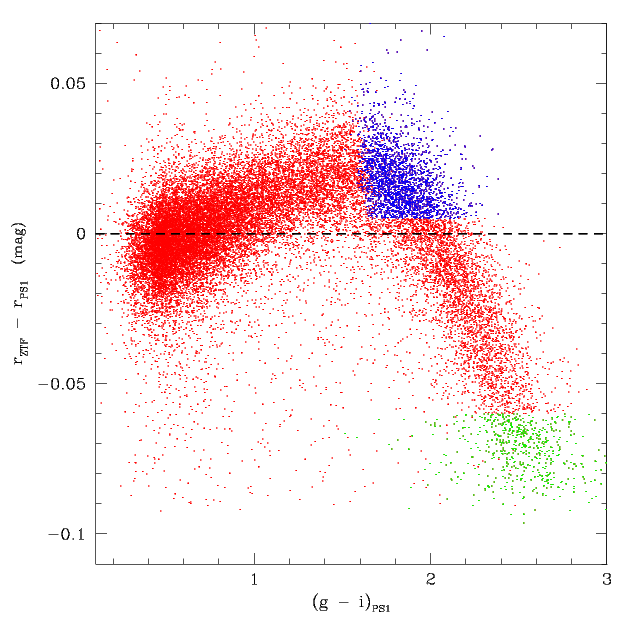
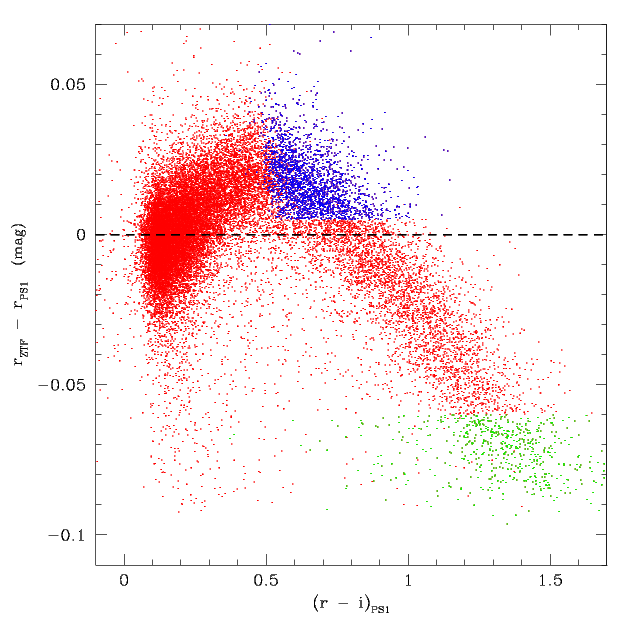
The distribution of photometric residuals from bright sources in Field 297 inlcuding PS1 i-band data. Left: the residuals vs PS1 g - i. Right: the residuals vs PS1 r-i.
The plots above suggest that PS1 i-band data can be used to remove residual trends. However, for stars with g - r < 1.0, the PS1 (g - r) mags should be best.
Residual trends in Other ZTF Fields
Expanding the residual analysis to other ZTF fields we see similar features in many that are away from the Galactic plane.
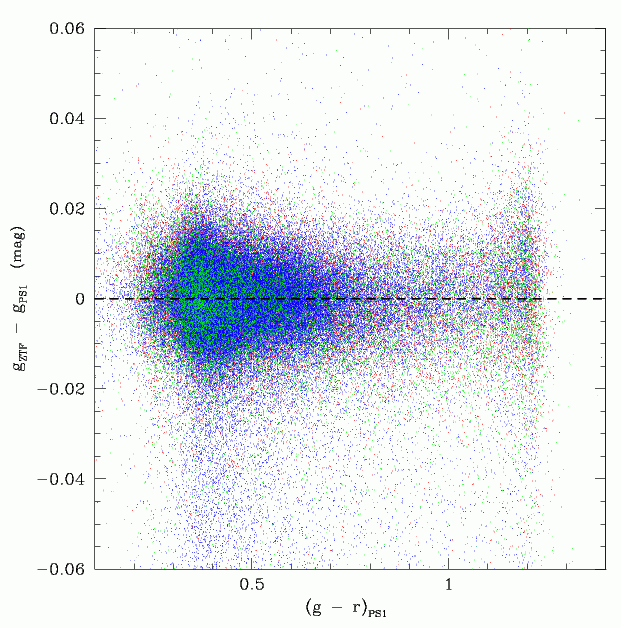
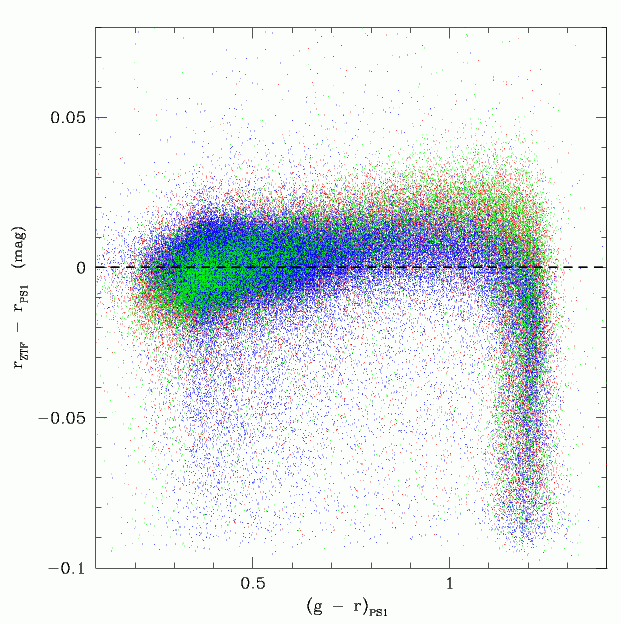
Photometric residuals for stars with 13.5 < mag < 18 in ZTF fields 423, 682 and 717 (with l,b=303.0, 59.95; 58.61, 26.74 and 96.81, 75.05, respectively). Red points field 423, green field 682 blue field 727. Left: the g-band residual dependence. Right: the r-band residual dependence.
Among the fields in the plot above we see a trend where fields closer to the Galactic plane (e.g. 682, blue pts) have less significant trends in their residual.
This flattening trend becomes more extreme in crowded fields nearer to the Galactic plane. For example, ZTF field 487 (l=36.56, b=3.03), exhibits very different residual structure than the halo fields as shown below.
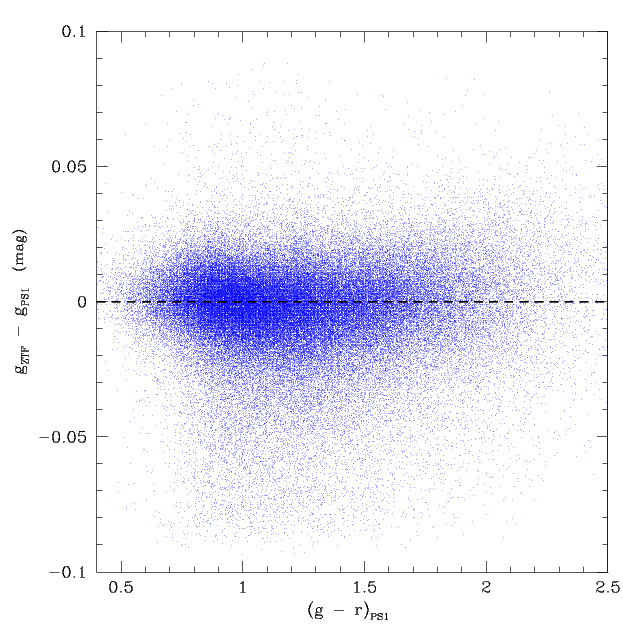
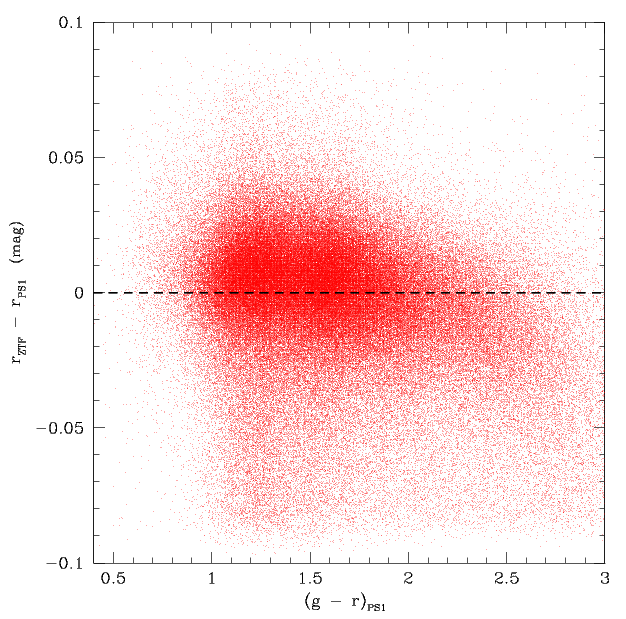
Photometric residuals for sources 13.5 < mag < 18 in ZTF Field 487 vs PS1 colour. This data is calibrated to PS1. Left: the g-band residual dependence. Right: The r-band dependence.
ZTF field 487 has very significant variations in reddening across the field as shown by the quadrant colour distributions below. This complicates interpretion of the cause of the residuals.
To some extent the structure may be similar, but the lack of blue stars may make it less evident. Additionally, the crowded Galactic plane fields have far more calibrators leading to more accurate colour coefficients and zero points. It is possible that the redder average colours of the calibrators in these fields also reduces the residual colour trend. Even internal to the quadrants there are varying degrees of reddening in this field.
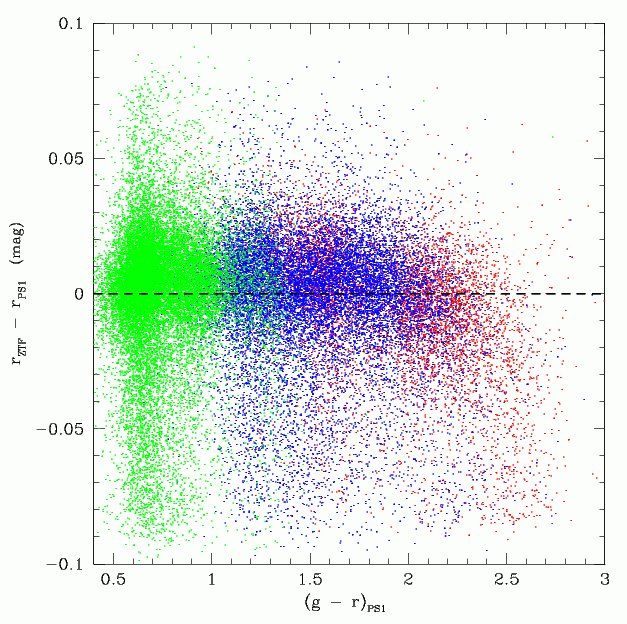
Photometric residuals for sources 13.5 < mag < 18 in ZTF Field 487 vs PS1 colour for three quadrants. Red pts: ccd 4 quadrant 4, blue pts: ccd 7 quadrant 3, green pts: ccd 16 quadrant 2.
The other Galactic plane fields shown below also do not exhibit the strong colour dependent residual photometric structure in r-band that is seen in the halo fields above. However, in these cases the stellar population is very different.
The foreground disk stars still produce a feature in the r-band residuals of the Galactic plane fields (at g-r ~1.45). The exact location of this feature varies slightly in (g-r) between the fields. This is likely due to the slight amount foreground reddening for these foreground stars that also varying with Galactic latitude and longitude. This feature is expected to be more evident at fainter magnitude limits where the number of M-dwarfs dominate.
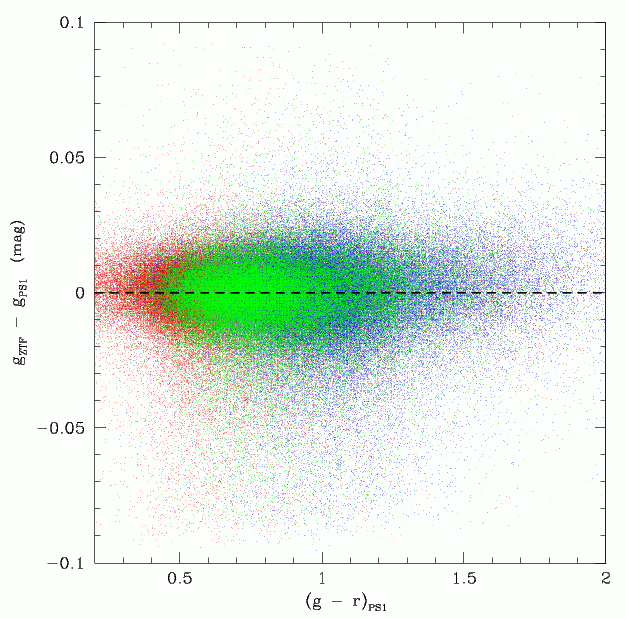
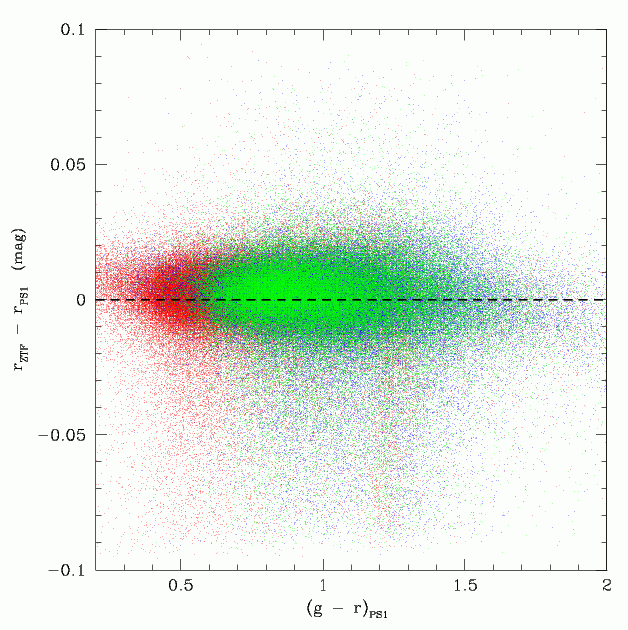
Photometric residuals for stars 13.5 < mag < 18 in ZTF fields 852, 777 and 562 (with l,b=110.25, 10.59; 143.26, -1.72 and 189.84, -2.98, respectively). Red points field 852, blue points 777, green points 562. Left: the g-band residual dependence. Right: The r-band dependence.
The variations of the colour dependency of photometric residuals with field will make corrections difficult. It may be necessary to perform colour corrections on a field or even CCD or quadrant basis.
Conclusions for residual colour trends
In r-band photometry we see trends in difference between the calibrated and corrected ZTF PSF magnitudes and PS1 magnitudes with source colour. The amplitude of these trends varies significant with the field location. In halo fields removal of this trend requires additional colour information (not just PS1 g and r), such as PS1 i-band magnitudes, for sources with g - r >~ 1.0.There is also evidence for trends in the residuals for calibrated and corrected g-band photometry. However, these appear much smaller. The lower amplitude may be due to ZTF g-band being closer to PS1 g-band than ZTF r-band is to PS1 r-band.
Residual trends with PSF shape
It is generally expected that the PSF shape of stars within a field will exhibit some variation with colour. For example, differential refraction effects blue and red stars to a different extent because the flux distribution within a photometric band varies. Thus it is likely the photometry with also exhibit some variation due to changes in PSF shape with colour. Such difference could potentially be determined by variations in the PSF fit FWHM with colour. Unfortunately this information is not available within the photometry matchfiles. Another possiblity is to look that the PSF fit chi value. This is available and is defined as:
Note 1: chi may be more useful than FWHM since it is possible to average over
all observations, while FWHM varies significantly between each observation
with seeing (thus requiring normalization).
Note 2: values noted as Chi^2 below are actually just Chi.
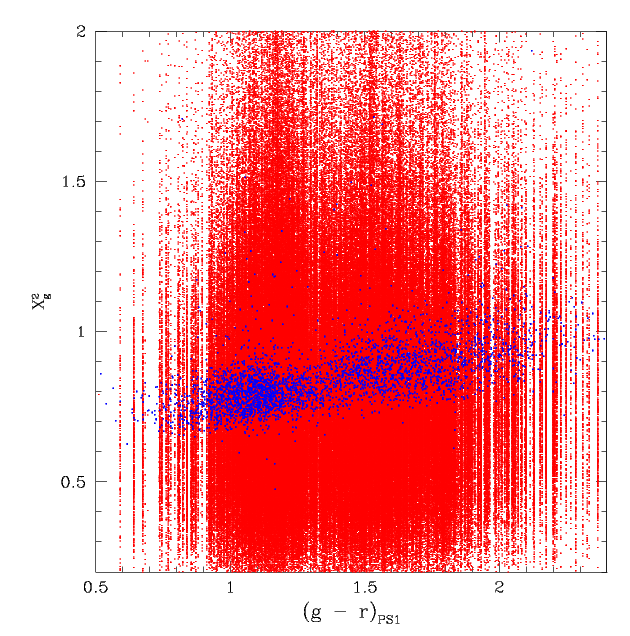
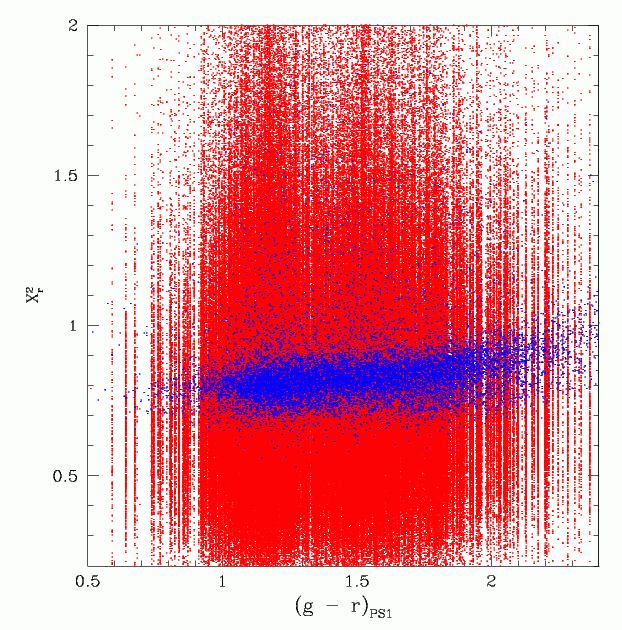
The dependence of chi on colour. Red points all measure for bright source in field 487, CCD 7, quadrant 3. Blue points the average values. Left: g-band data. Right: r-band data.
In the plot above we see that the average PSF chi values vary with the colours of the stars. This strongly suggesting that PSF shape also varies with colour.
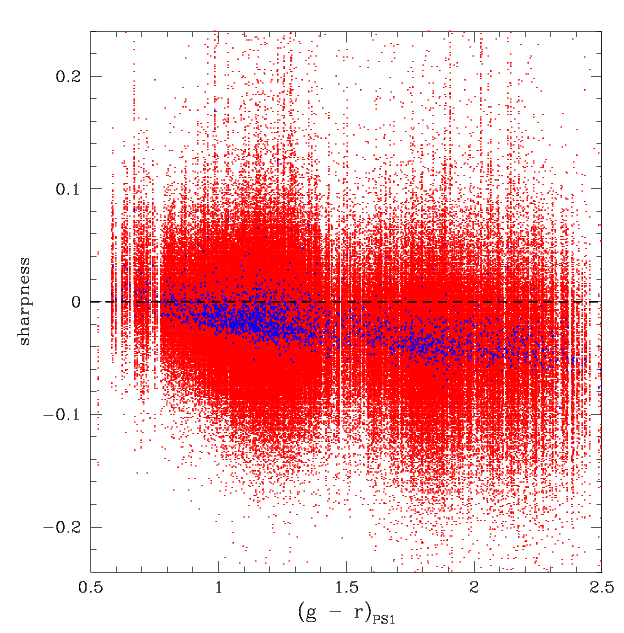
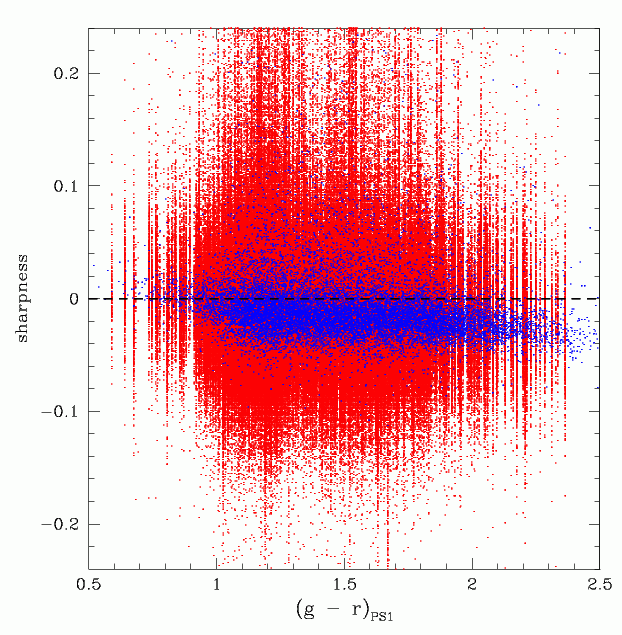
The dependence of sharpness (PSF shape) on colour. Red points all measure for bright source in field 487, CCD 7, quadrant 3. Blue points the average values. Left: g-band data. Right r-band data.
Another means of quantifying the PSF shapes of sources is their sharpness. Here this is define as:
Here FWHM^2_obs is a Gaussian fit to the source and FWHM_model is daophot model based on hundreds of stars. The above plot suggests that, as expected, the PSF varies with star colour. In fact, it suggests that the model is only close to Gaussian at blue colours.
Another expectation is that the PSF shape will vary with location. This variation is accounted for in ZTF using the linear model.
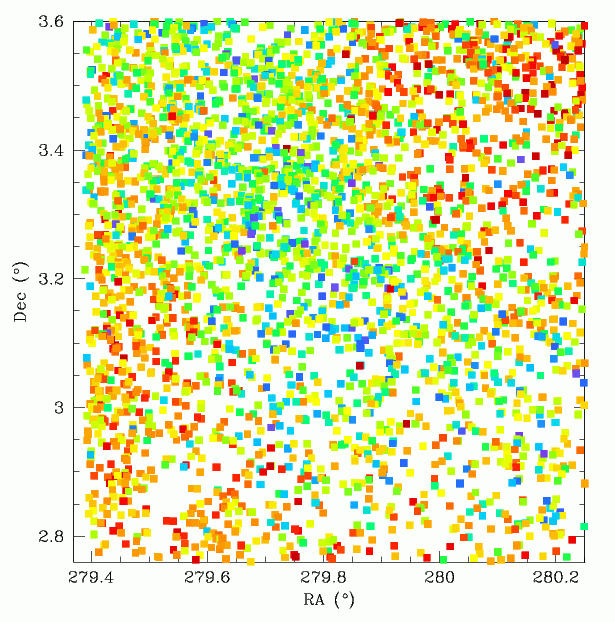
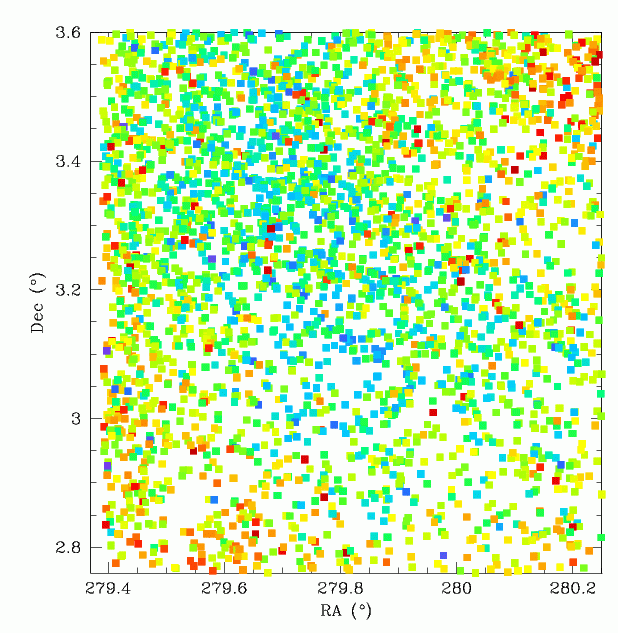
The spatial variation in g-band PSF fit chi and sharpness (PSF shape) with location in ZTF field 487, CCD 7, quadrant 3. Left: Average fit chi ranging from 0.7 to 1.1 (red to blue) Right: Average sharpness values ranging from -0.3 to 0 (blue to red).
If we look at the spatial distribution of average chi or sharpness we see that both are also dependent on location. Likewise, the average PSF Fit chi varies with position. The structure in these plots mirror each other since the PSF shape dominates each quantity. Interestingly, we see that the smallest chi values are in the corners (rather than the center where more calibrator stars are expected).
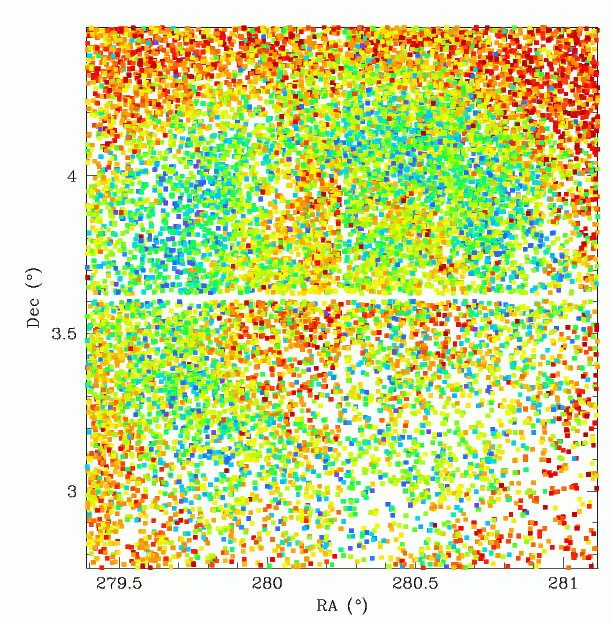
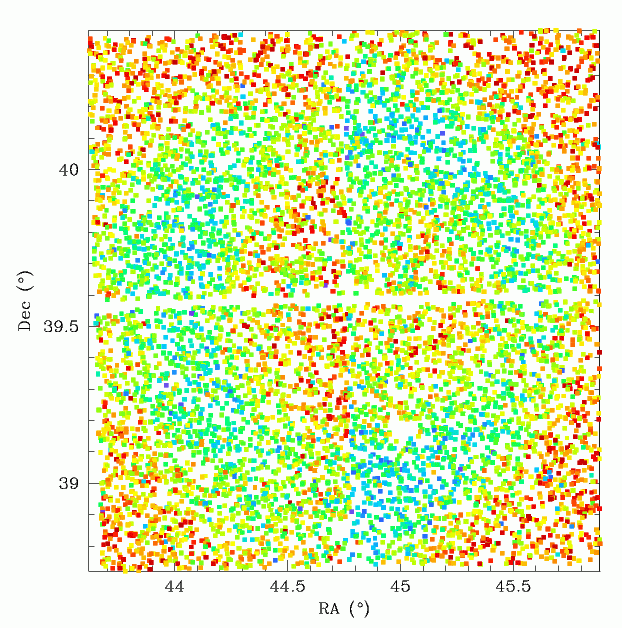
The spatial variation in average g-band PSF fit chi with location. Left: average chi values for ZTF field 487, CCD 7 (range 0.65 to 1.1, red to blue). Right: average chi values for ZTF field 699, CCD 7 (range 0.55 to 1.0, red to blue).
When we look at the average chi distribution over a full CCD field (CCD 07) we see the circular structure evident in the photometric residual maps is present. That is to say, at least some of the photometric residuals we see are likely due to poor PSF fitting. The same structure is seen in multiple fields.
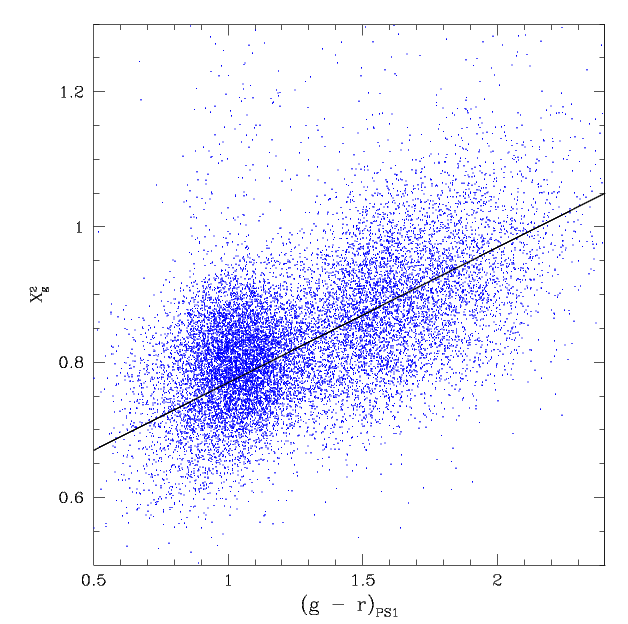
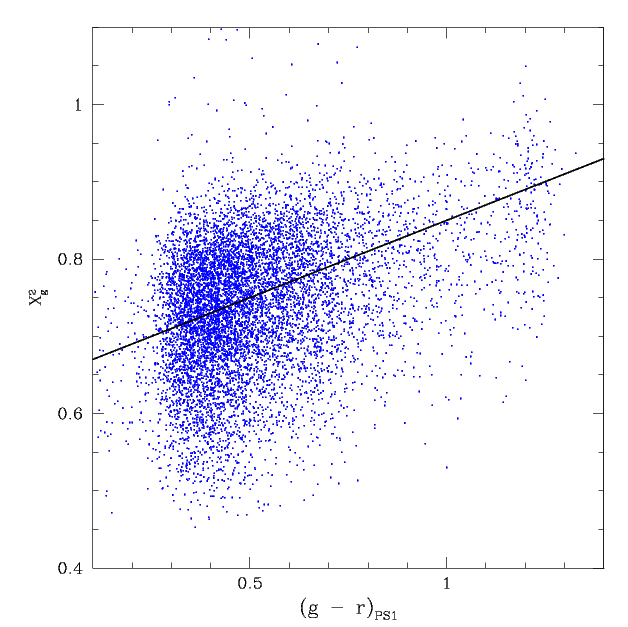
The g-band trend in average chi with colour for the full CCD 7 field. Left: ZTF field 487. The plotted line is chi= 0.57 + 0.2*(g-r) Right: ZTF field 699. The plotted line is chi = 0.65 + 0.2*(g-r)
To separate the colour trend from the spatial trend, we fit the trend (as shown above) and subtract it. The resulting colour-corrected trend is shown below.
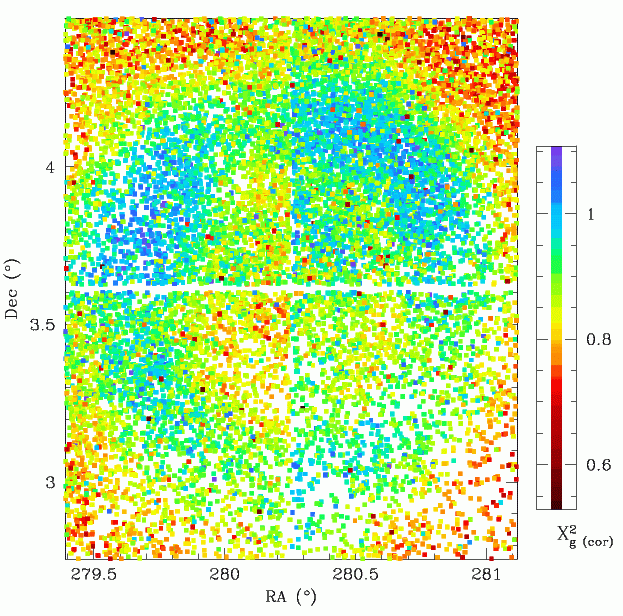
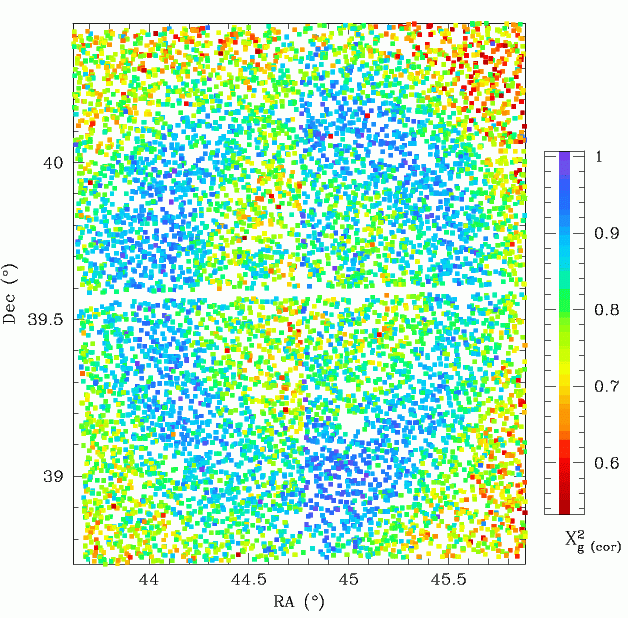
The spatial variation in average g-band PSF fit chi with location after removing the trend in g-r shown in the plots above. Left: average corrected chi values for ZTF field 487, CCD 7. Right: average corrected chi values for ZTF field 699, CCD 7.
As expected we get a cleaner view of the spatial trend in chi. This is almost certainly due to variation in the PSF shape with position.
Trends in photometric residuals with Chi and Sharpness
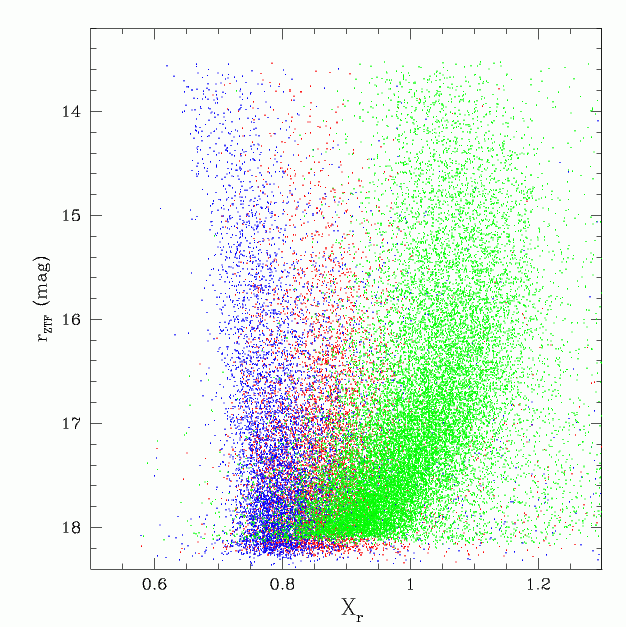
The variation of the average r-band PSF fit chi with star brightness for three quadrants in field 487. Red: ccd 4 quadrant 4, blue: ccd 7 quadrant 3, green: ccd 16 quadrant 2.
Stetson and Harris (1988, AJ, 96, 909, Fig. 28) suggest that the distribution of Chi values with magnitude should be close to 1, and have no trend in magnitude. However, as shown in the figure above, in r-band, this is clearly not the case within some ZTF fields. This is likely, in part, related to the variation in Chi with colour in feilds where the average star colour varies strongly with brightness.
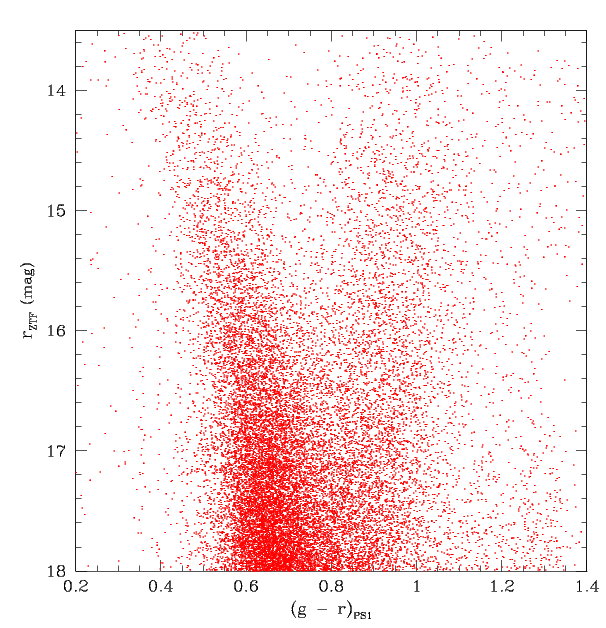
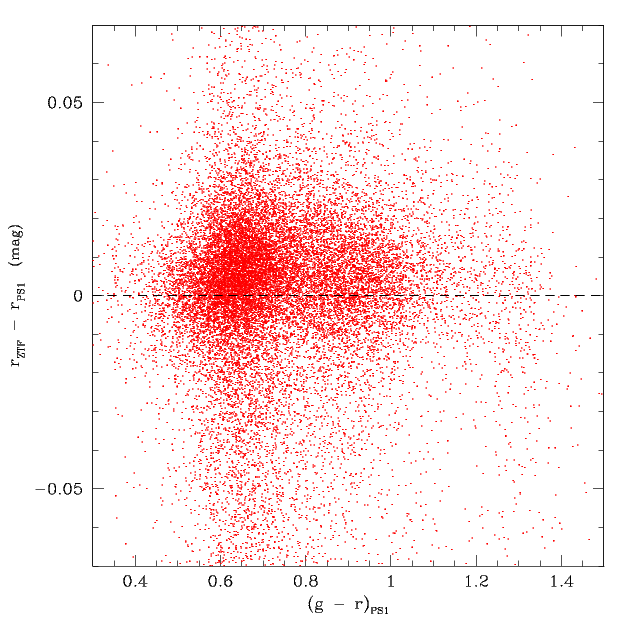
The CMD and r-band residuals for field 487, ccd 16, quadrant 2. Left: The r-band CMD. Right: The residuals calibrated to PS1.
To check this we take a closer look at a quadrant with strong structure (ccd 16 quadrant 2). This has a typical CMD. However, the r_ZTF - r_PS1 residuals do not show significant structure with g - r colour. This is very different from the less crowded halo fields above. Note, the is a systematic offset averages out when stars with r > 18 are included.
The lack of a difference between the SEDs of mid and late M-dwarfs within the r-band filter does not affect fields near the Galactic plane since these stars are sparse in the foreground and reddened to much fainter magnitudes when at greater distances.
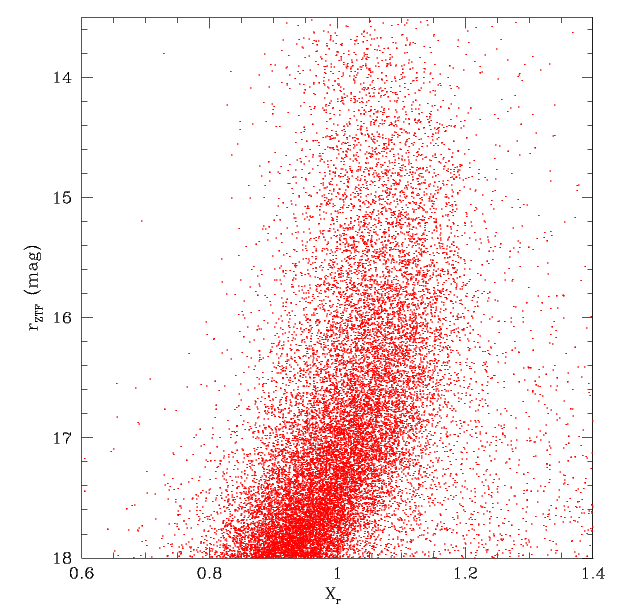
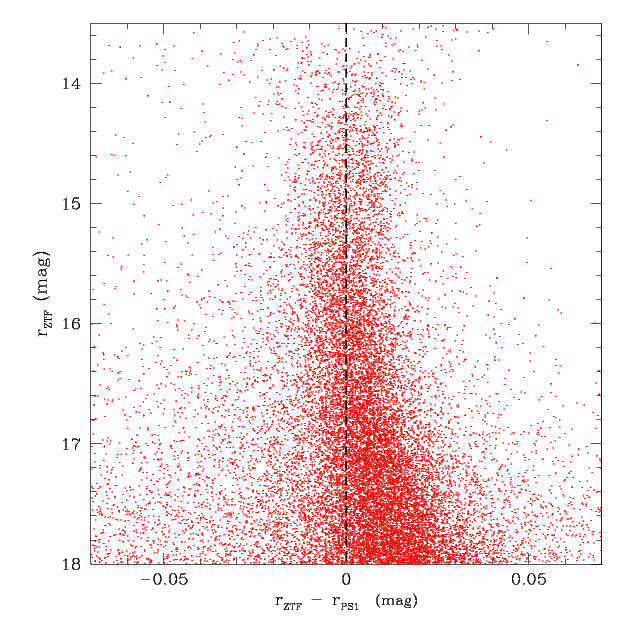
The r-band distribution of chi and residuals with magnitude for ccd 16 quadrant 2. Left: The distribution average r-band Chi vs PS1 r-band mag. Right: The distribution of average r-band residuals vs PS1 r-band mag.
When we plot the variation in Chi from the PSF fits vs source magnitude we see clear trends that correlate with the trend in r-band residuals. This is very different from halo field 297 (shown above) where no obvious trends were seen. The relationship here between Chi and r-band residuals is thus not straight forward in crowded Galactic plane fields due to a magnitude and colour dependence.
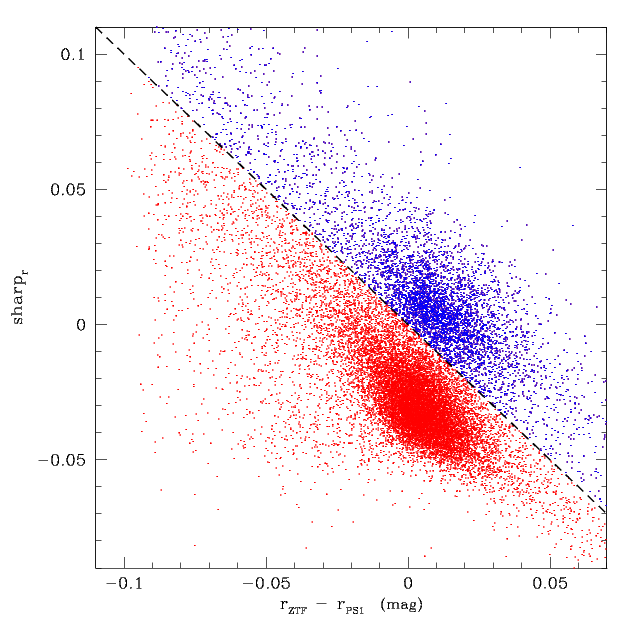
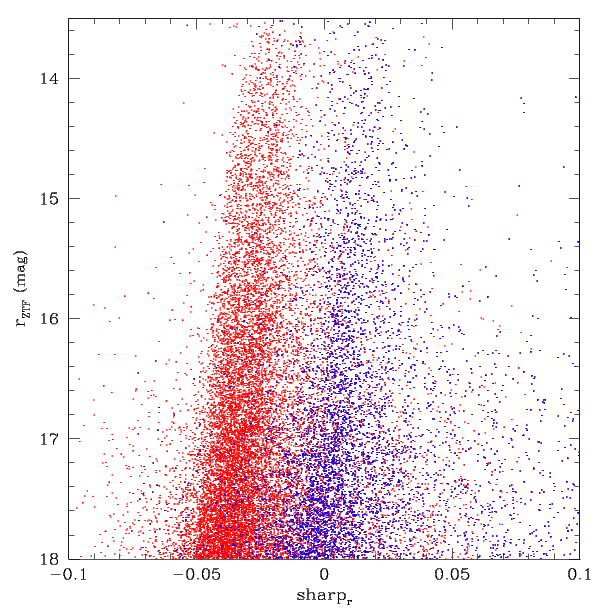
The r-band distribution of sharpness with magnitude difference and brightness for field 487, ccd 16 quadrant 2. Left: The residual distribution. Right: the brightness distibution.
Looking the distribution of sharpness values, we see that there are clearly two separate sets of points within a quadrant which are offset. However, both exhibit the same linear trend between sharpness and residuals. In addition, there is a clear variation in sharpness with source magnitude (likely caused by the brighter fatter effect), pointing to variations in the PSF shape with magnitude.
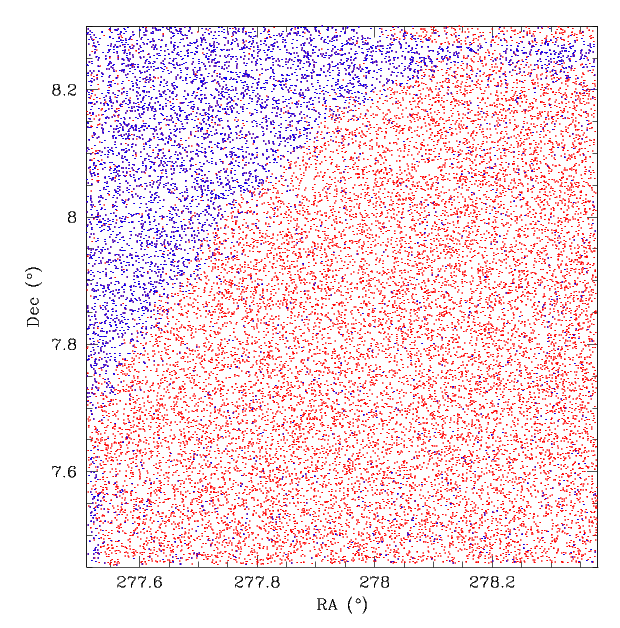
The spatial distribution of the two sets of points selected with different sharpness vs residual magnitude for field 487, ccd 16 quadrant 2.
Examining the spatial distribution of sharpness from the two sets of points above we see a very clear separation (Note, this quadrant is on the edge of the camera). The plot suggests a distinct change in PSF shape that gives rise to a systematic offset in sharpness and thus residuals. A change in PSF shape is also suggested by the residuals of difference images for this field/quadrant.

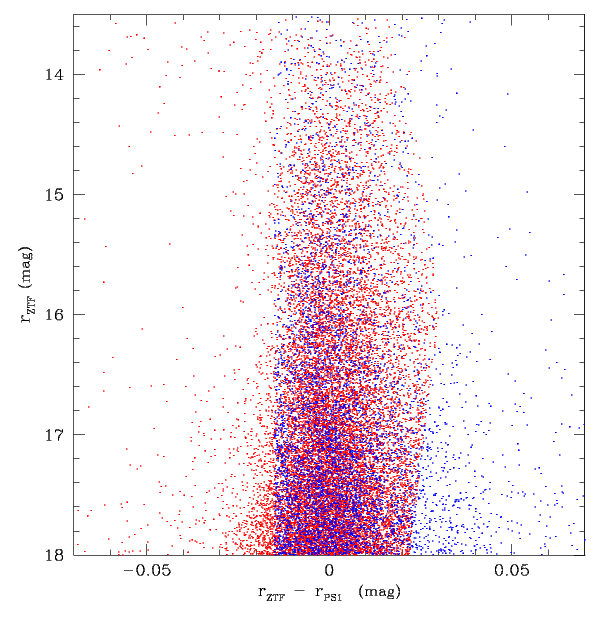
The distribution in r-band residuals vs magnitude for field 487, ccd 16 quadrant 2. Left: the raw residuals. Right: residuals after account for the trend in sharpness with magnitude and the two separate linear trends in residuals with sharpness.
By correcting the residuals for the sharpness trend seen above for each of two sets of points we arrive at the figure above. Notable is the removal of the halo of outlier sources at faint magnitudes is corrected by using the linear relationship between sharpness and residuals. Nevertheless, the relationship between sharpness and photometric residuals was seen to vary between quadrants. The relationship is poorly defined in many quadrants (as the residuals are too small) and appears to vary in slope for the same quadrant+filter when observed in different fields. This suggests a simple correction to remove residuals based on sharpness or chi statics is not possible.
Overall Conclusions
ZTF g-band photometry shows a significant systematic trends in Daophot PSF fit-based chi values with colour. This trend is weaker in ZTF r-band (most likely due to less wavelength dependency of PSF shape in r). Fitting and subtracting out the g-band colour dependency from the chi values reveals clear circular spatial dependencies that match those seen in earlier photometric residual maps. The spatial trend is also seen in the average values of sharpness, which is more directly related to PSF shape than chi.Note: all of the photometry used here already has the underlying spatial structure removed, so the PSF-based effects can only be seen chi and sharpness statistics.
In crowded fields, where the colour dependence of the photometric residuals is smaller than halo fields, there are trends in PSF fit chi and sharpness values with source brightness. These trends are strongly correlated with the residual difference between the calibrated ZTF and PS1 magnitudes.
In summary, improved ZTF photometric calibration relative to PS1 requires additional colour information as well as fitting and removal of the remaining trends in residuals with colour and brightness per field. Parameters such as chi and sharpness can be used to further improve the calibrations, but these are quadrant and field dependent.