| Topics |
|---|
| Photometric Residuals in Four Quadrants. |
| Spatial Structure, CCD and filter dependence of photometry. |
| Systematic Variations between ZTF and PS1 Photometry. |
| RMS uncertainties across filters. |
| Spatial Structure between ZTF and PS1 photometry. |
| Discussion. |
ZTF Photometric Residuals and Variation with Source Brightness in Four Quadrants
Following our complete calibration of all ZTF photometry taken up until July 1st 2021 we determine the underlying systematic residuals for all ZTF PSF photometry at the quadrant level.
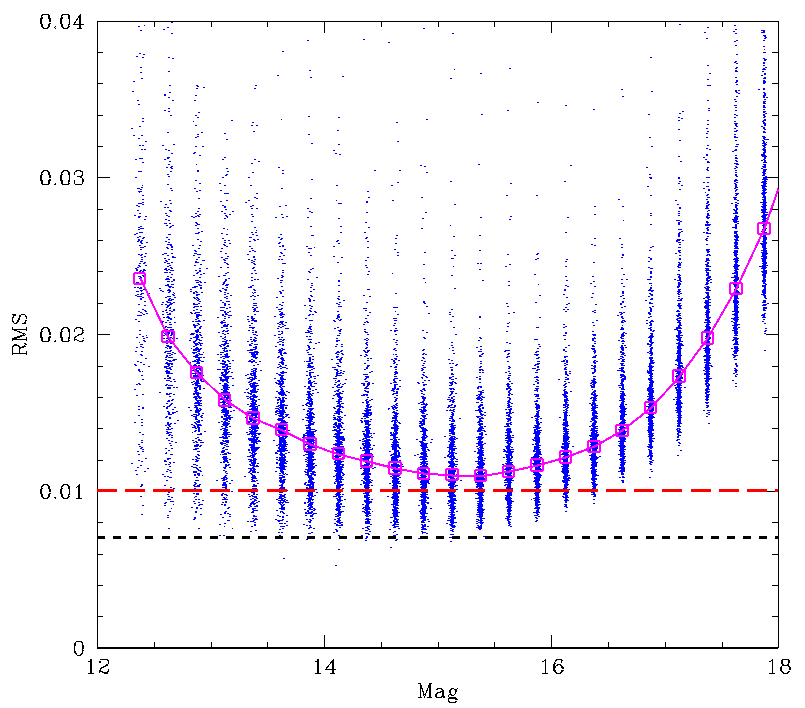
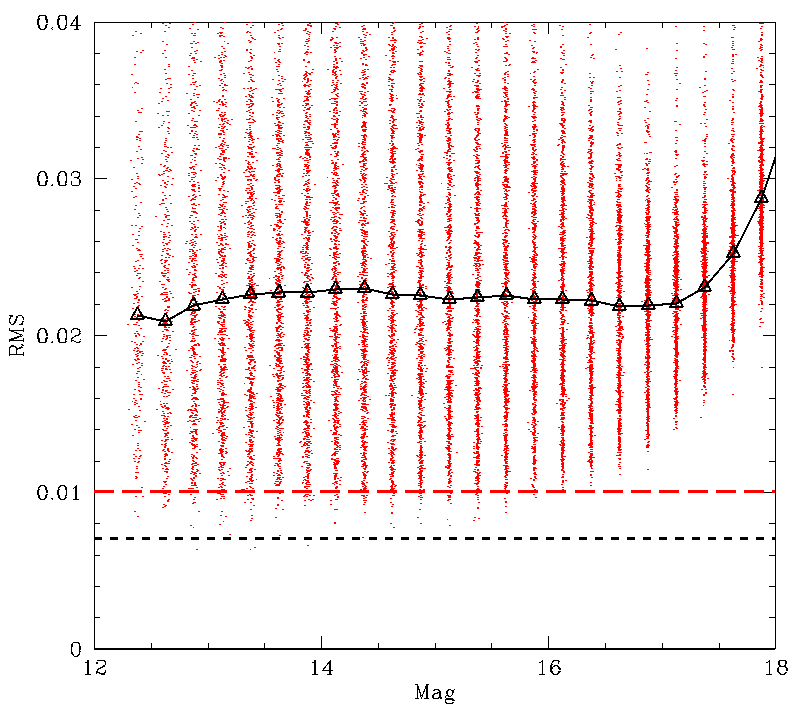
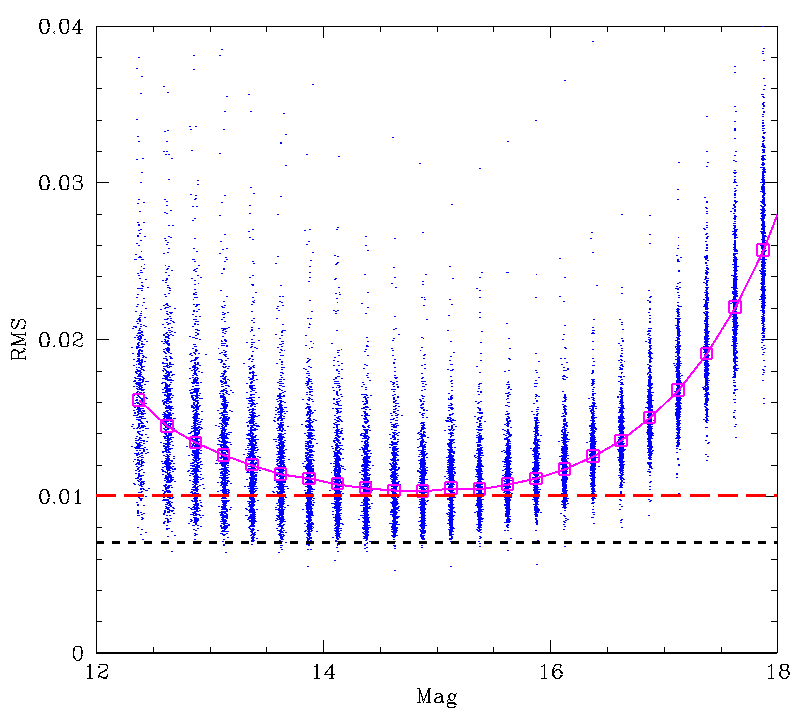
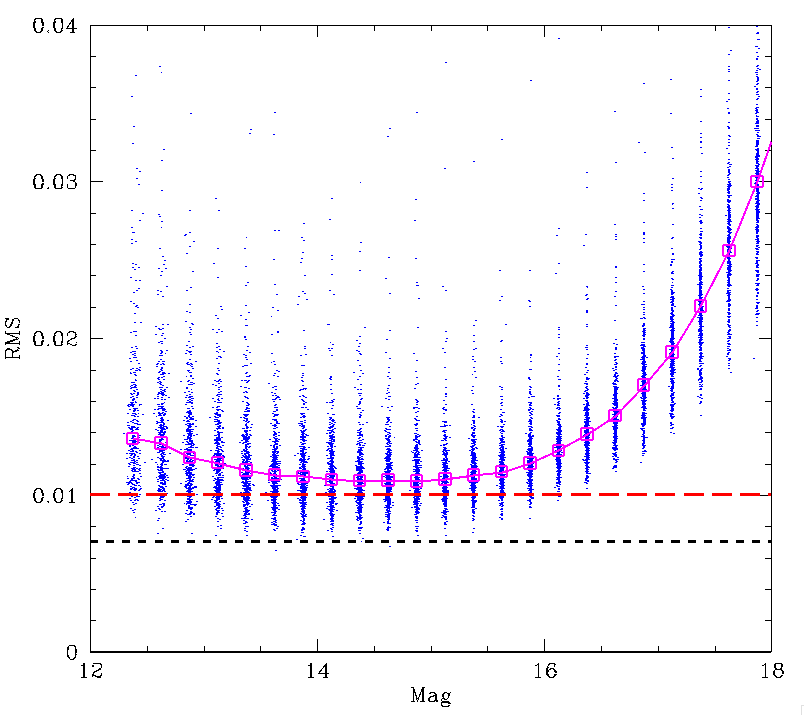
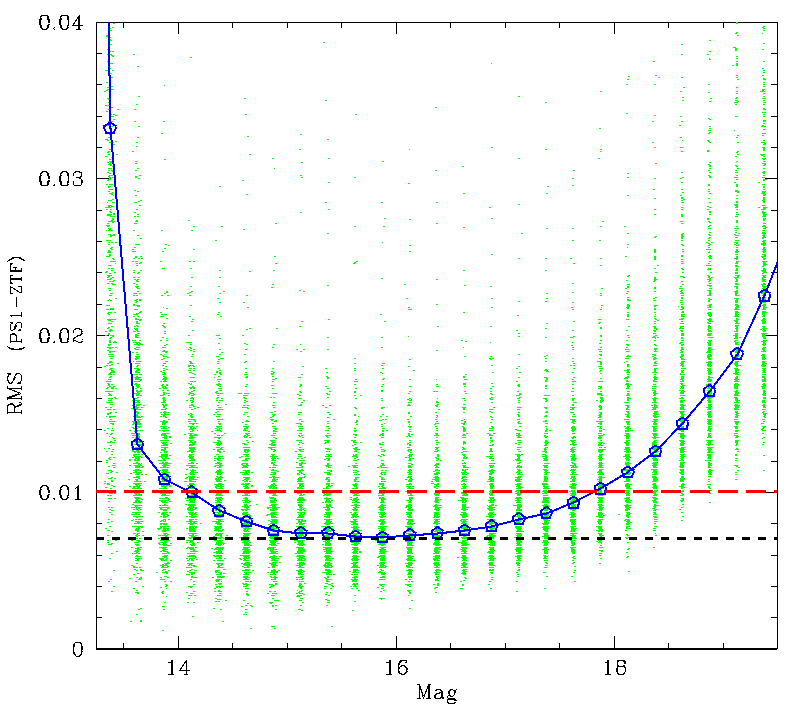
The ZTF g-band Zubercal photometric RMS within a ZTF quadrant. The four quadrants are CCD6,q4; CCD7,q3; CCD10,q1; and CCD11,q2. Each blue data point within a 0.25 magnitude range shows the observed robust (MAD-based) sigma for all sources within a field. There are thus ~40 mag bins x ~1000 fields ~ 40000 points per plot. The magenta line connects the median within each mag bin range.
In the plots above we see that the median uncertainties of sources are ~1% at g-band magnitudes of ~15. There is some slight variation between fields. Bright sources have greater uncertainties due to saturation, the brighter-fatter effect and detector non-linearity.
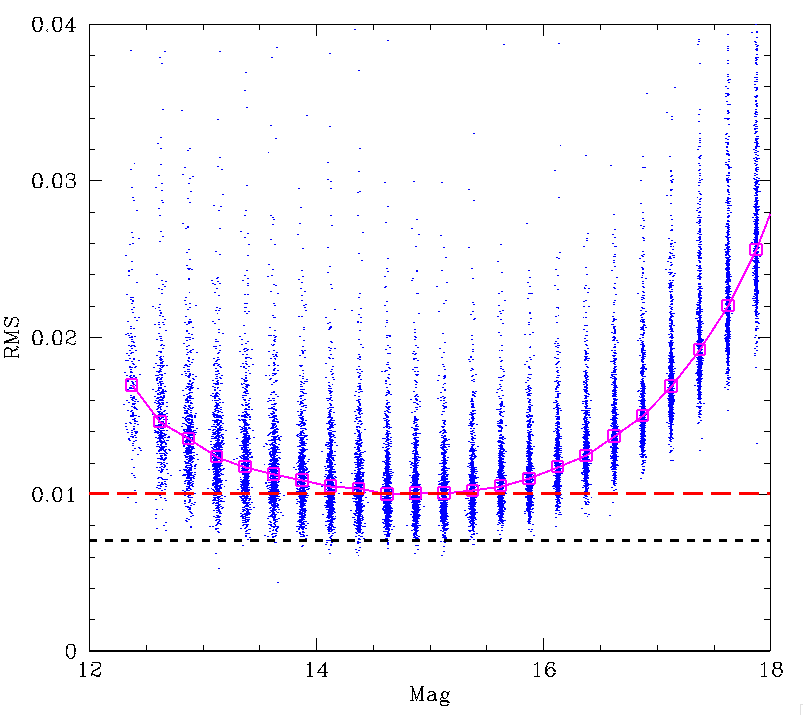
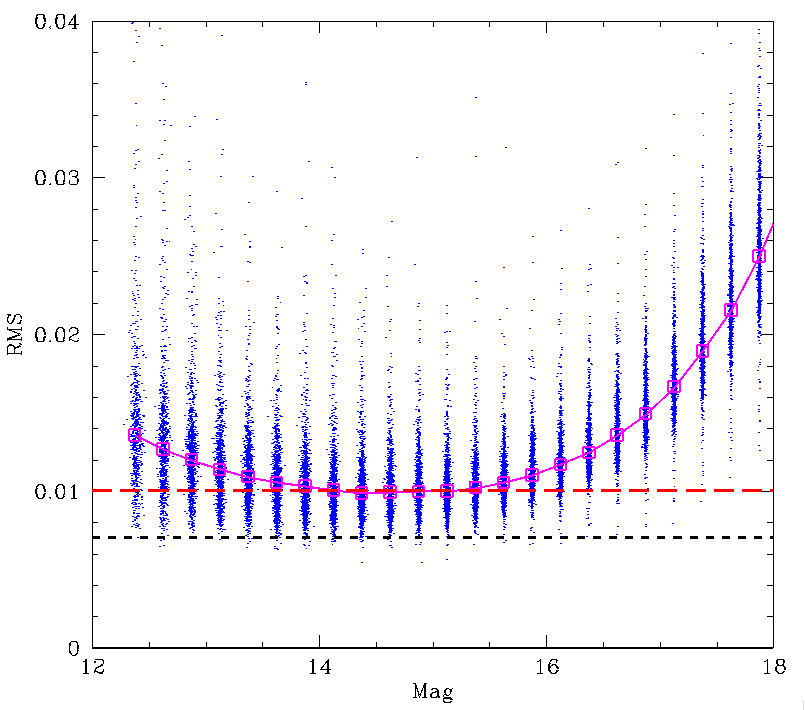
As a comparison we compute the RMS values based on the original ZTF photometric calibration with the addition corrections for colour, time, spatial and transparency corrections.
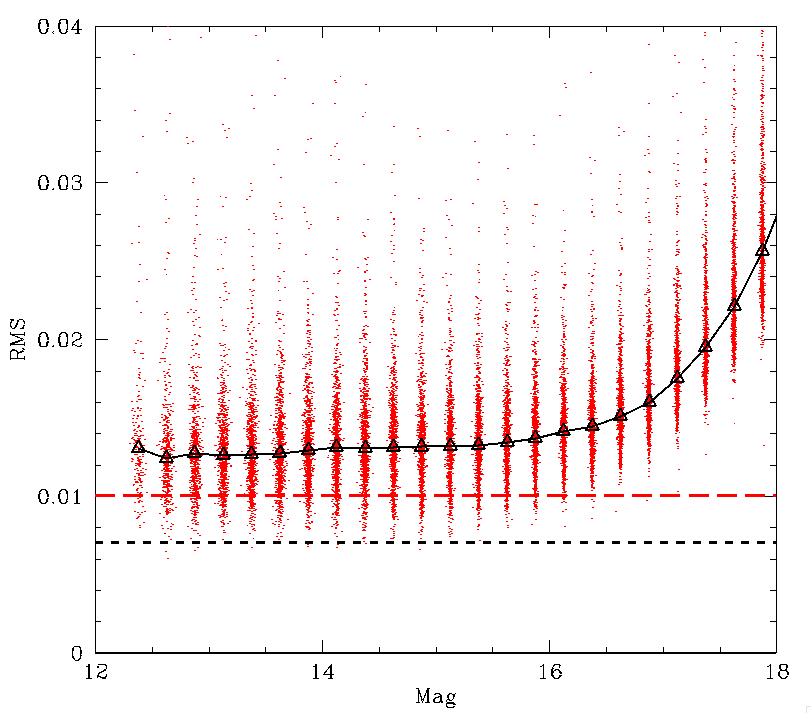
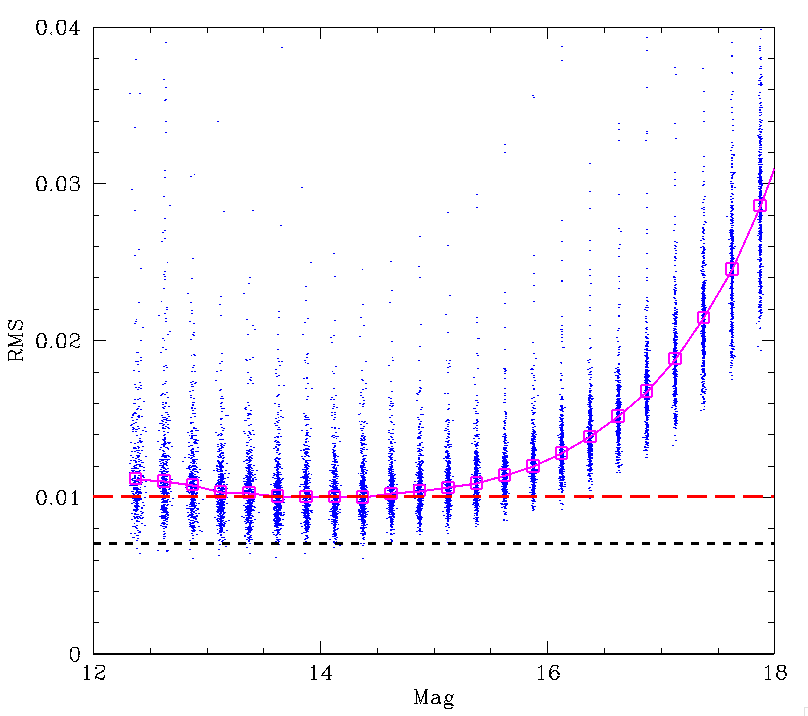
As above, but for g-band observations but using original ZTF photometric calibration.
In the plot above we see the original (current) ZTF calibration is mush poorer than the new calibration. This is particularly the case for CCD6 that exhibits significant variation in RMS between fields.
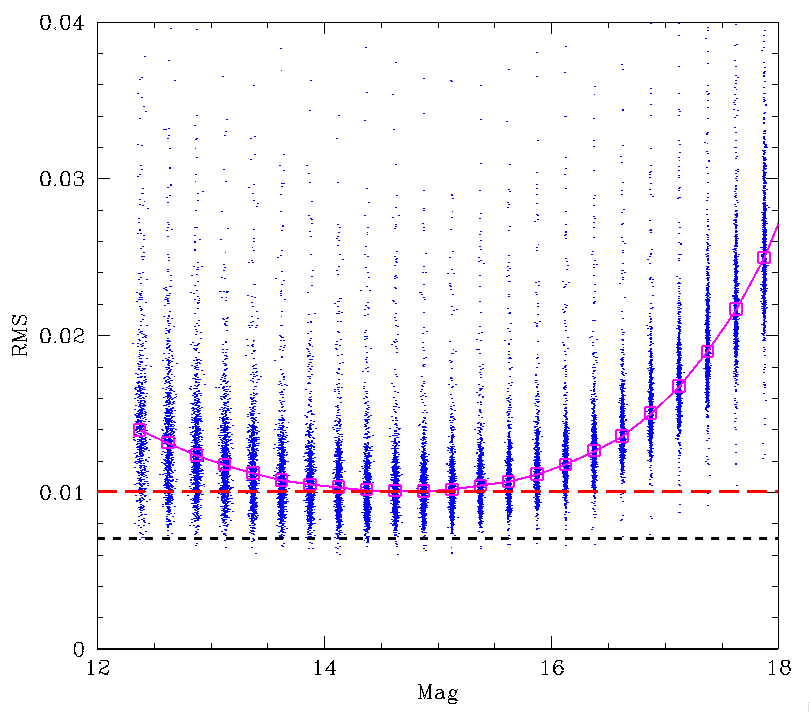
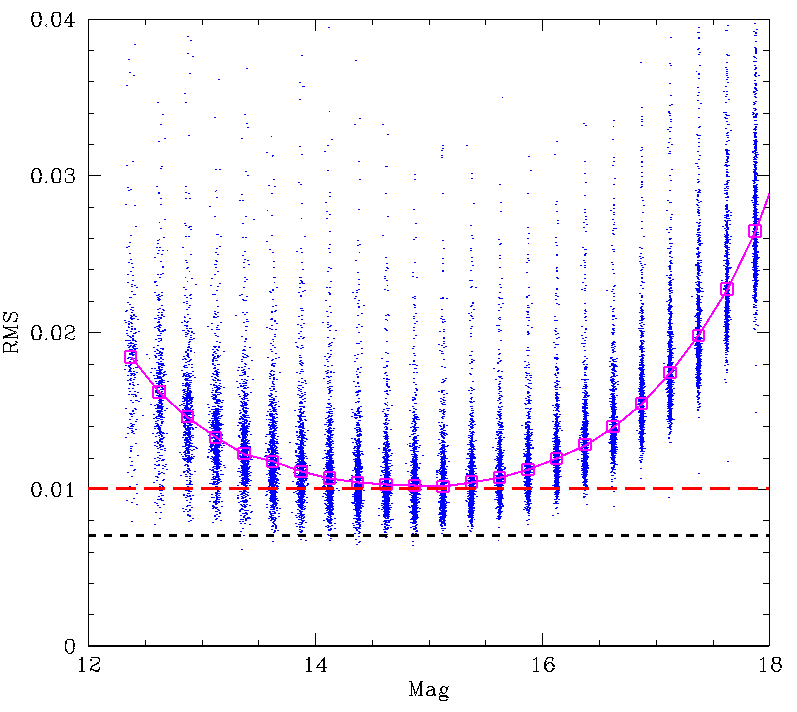
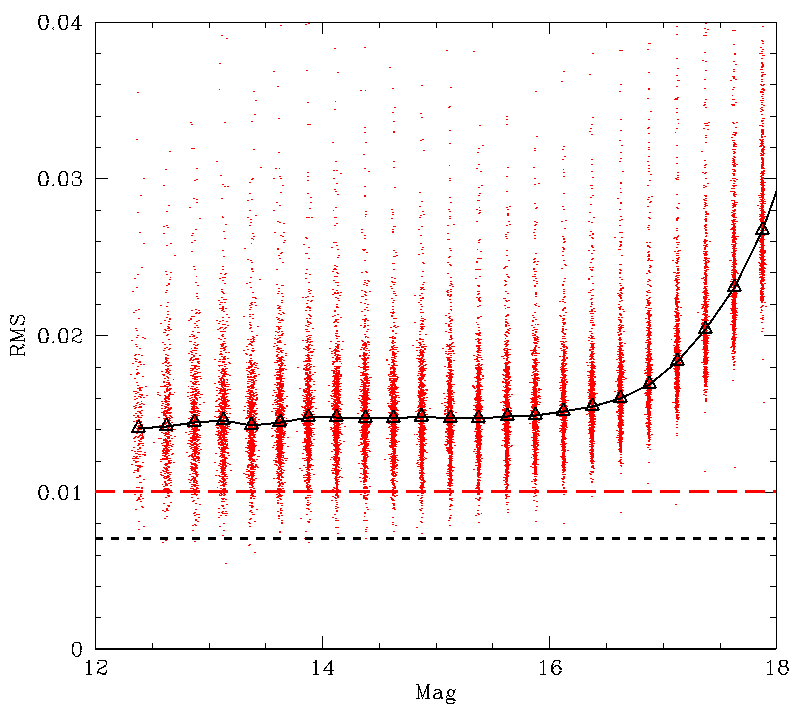
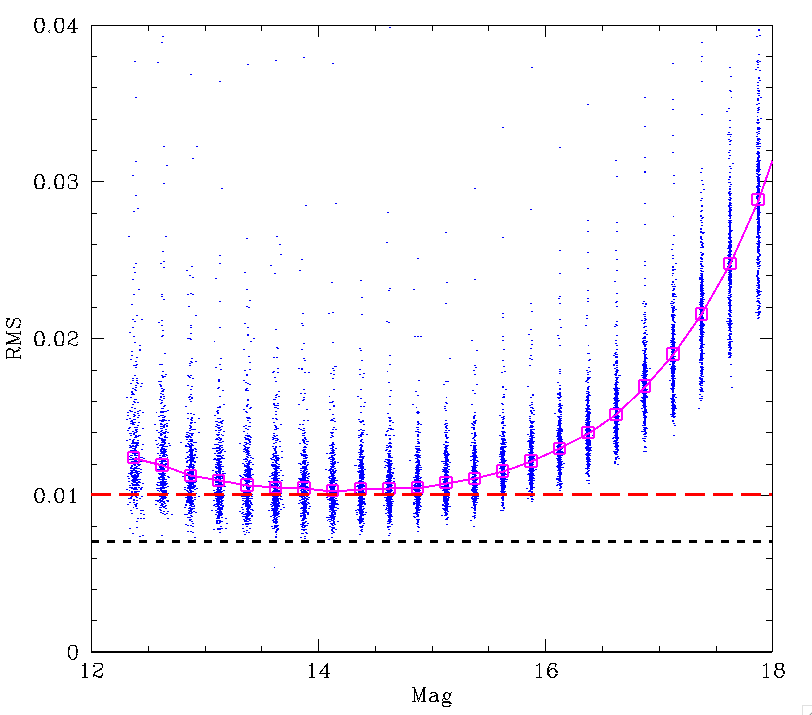
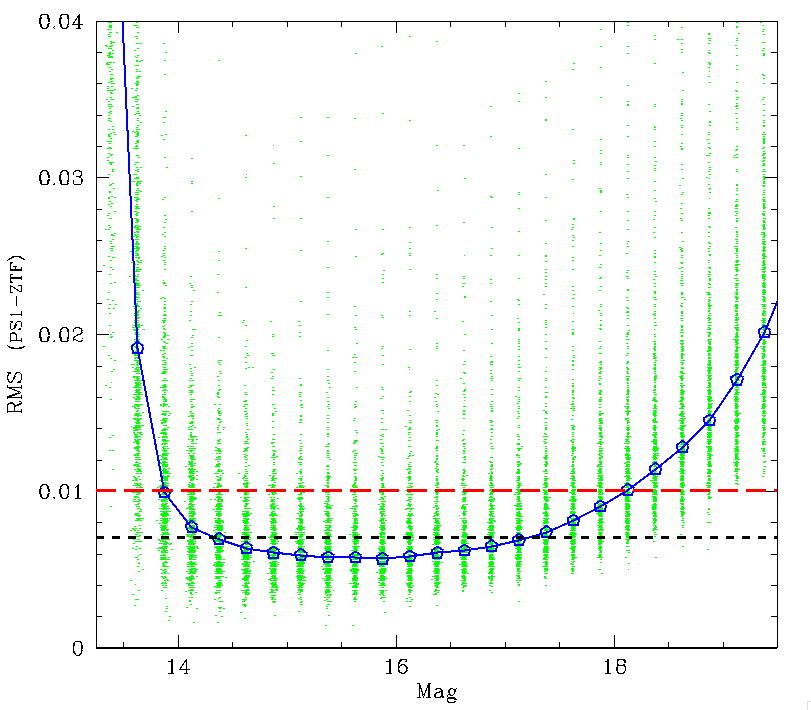
ZTF photometric residuals based on Zubrecal as above, but for r-band observations.
In the plot above we see that r-band data has slightly smaller uncertainties that g-band. This is also clear for bright sources.
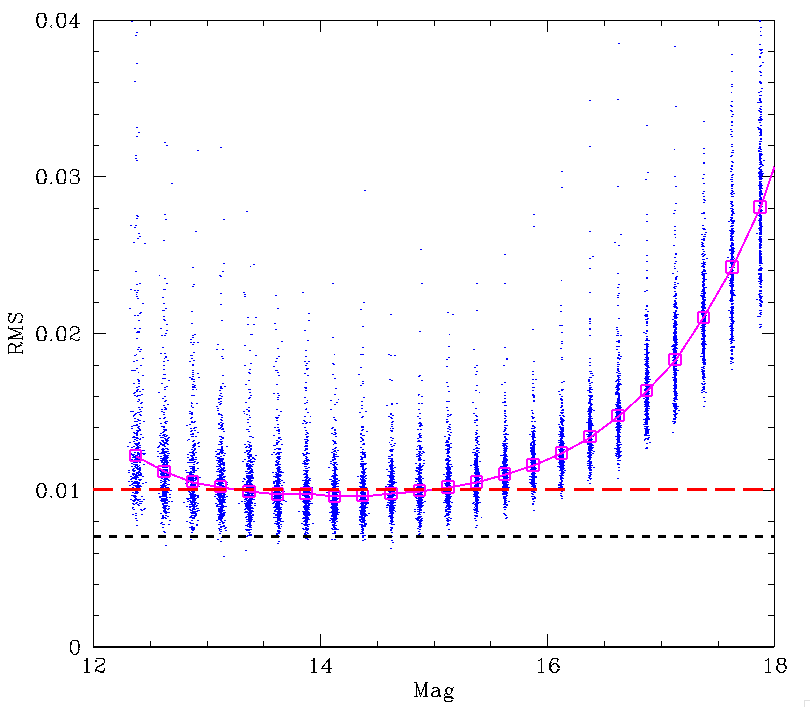
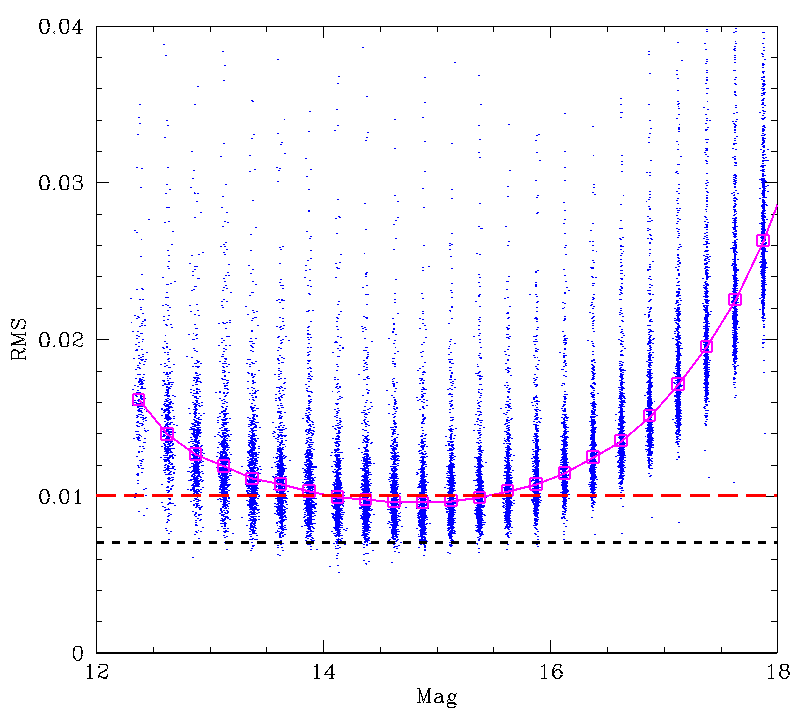
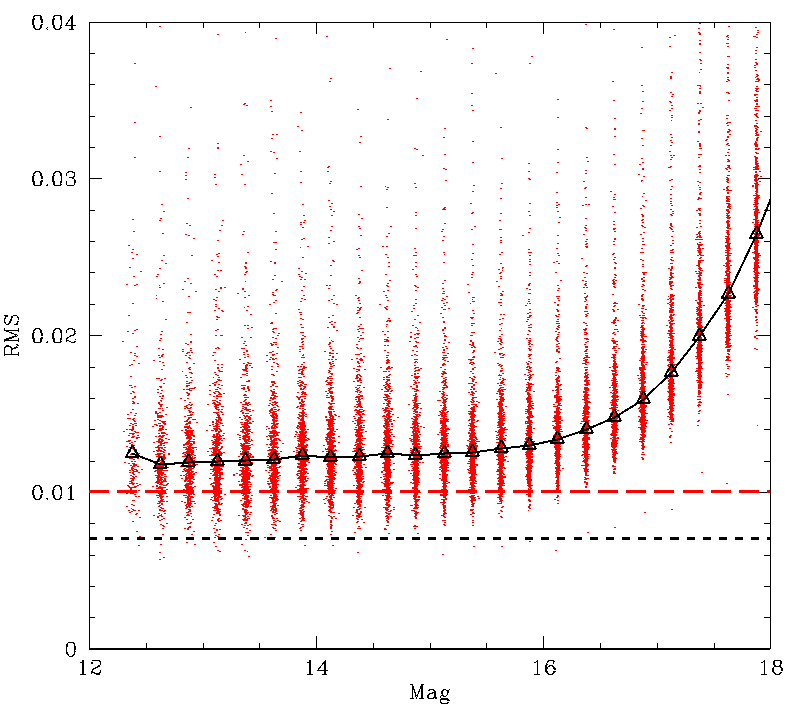
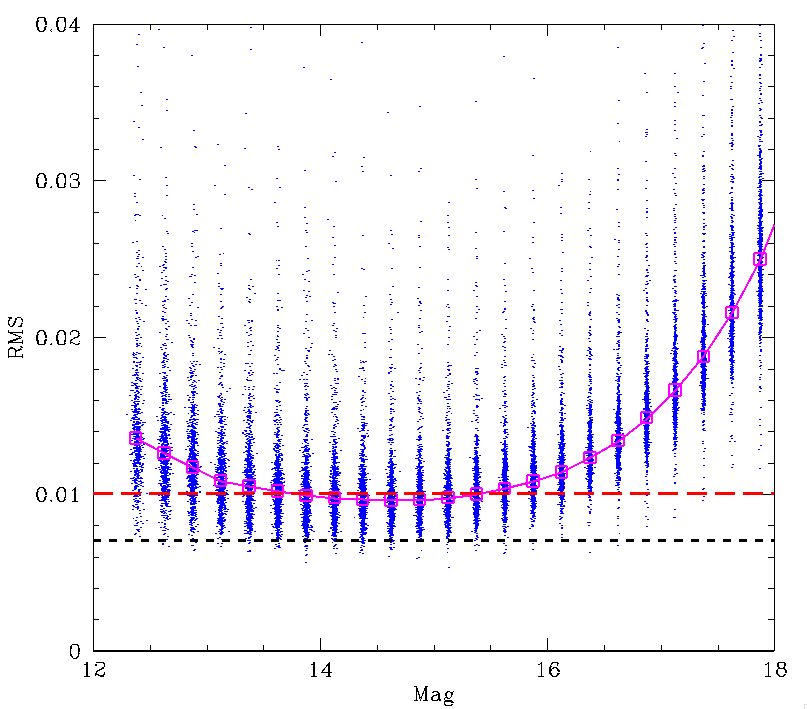
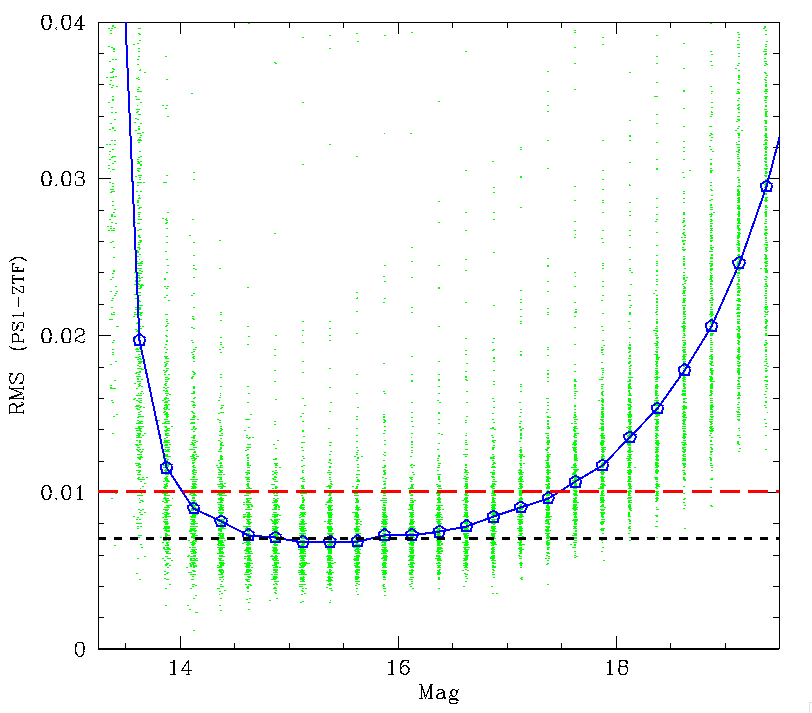
ZTF photometric residuals based on Zubercal as above, but for i-band observations.
In the plots above we once again see similar uncertainties to g-band and an even small increase in uncertainty for bright stars.
Spatial Structure, CCD and filter dependence of photometry
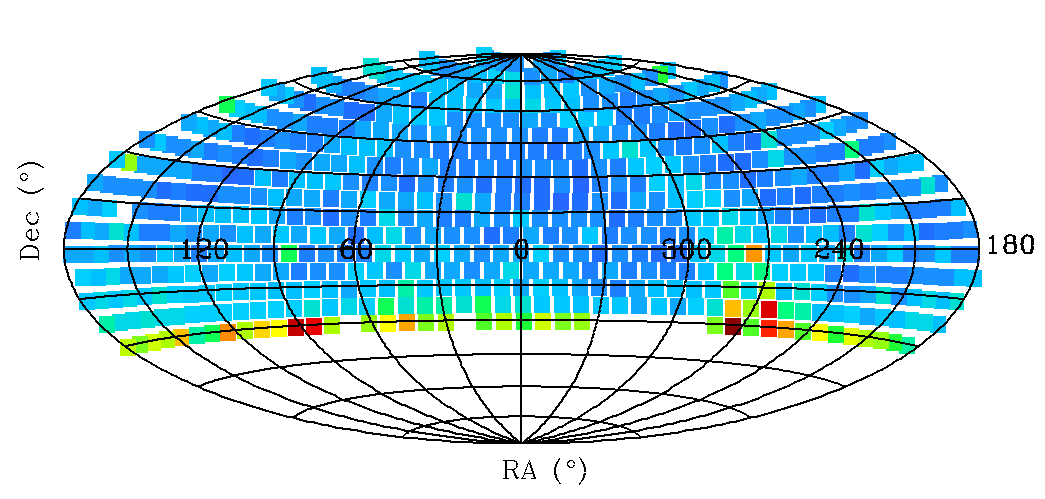
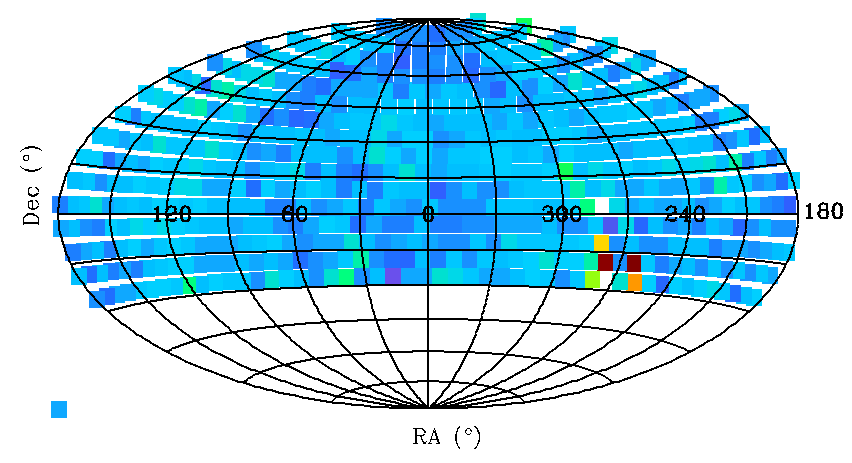
In order to better understand the spatial dependence of the photometric accuracy we have plotted the locations of the quadrants analysed and colour coded them by the RMS. The plots are only for sources with median magnitudes 14 < mag < 15 (the most accurate range) and quadrants have been expanded to see better see them.
CCD 6 quadrant 4
CCD 11 quadrant 2
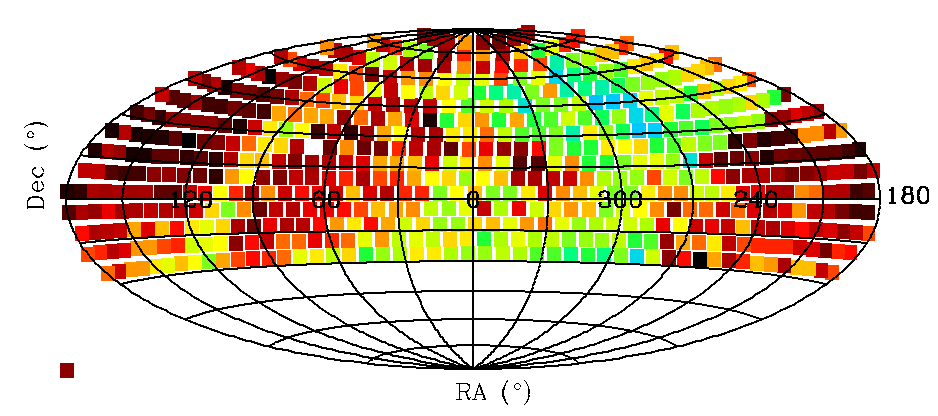
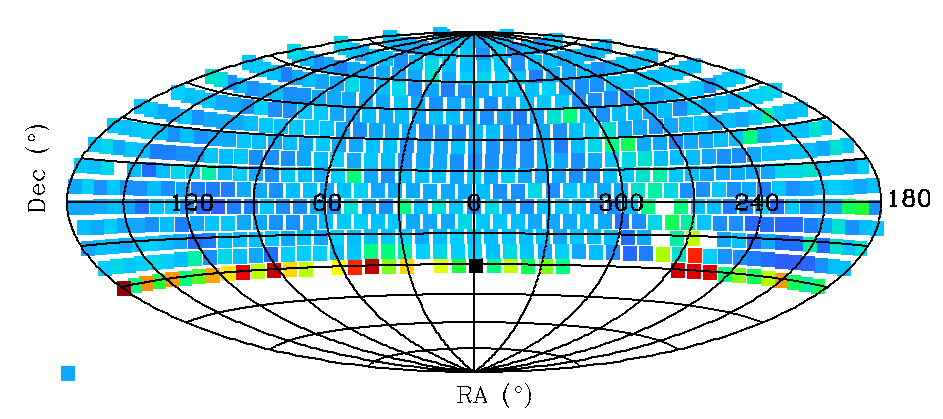
Spatial variation in source RMS for ZTF g-band sources.
In the top two plot we show sources falling in CCD6 quadrant 4
and in the bottom CCD 11 quadrant 2.
Left plots are results
using the original (current) calibration. Right plots using
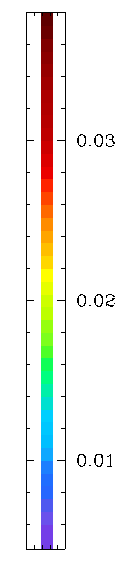
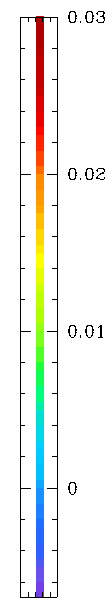
Zubercal calibration. The colour bar denotes the RMS in that
quadrant.
For the above plot we can see that there is significant spatial variation in photometric RMS. CCD 6 has the poorest accuracy of all ZTF CCDs with scatter > 2% in the original photometry. We also see that the new Zuber calibration significantly improves the calibration in all ZTF fields. Notably we see that the most southerly declination fields have poor accuracy due to high airmass. Fields along the Galactic plane also have slightly poorer accuracy than less crowded fields.
CCD 6 quadrant 4
CCD 11 quadrant 2
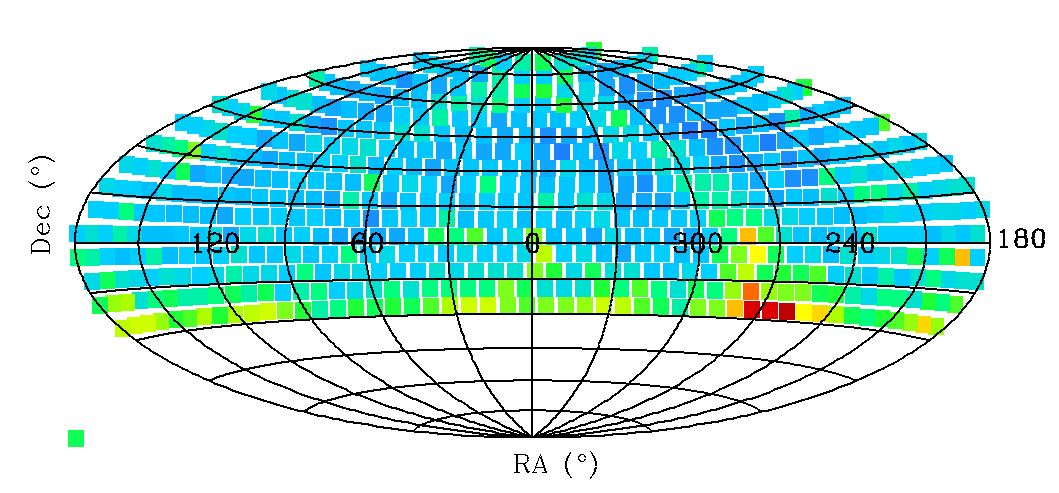
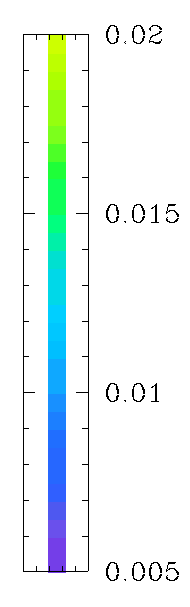
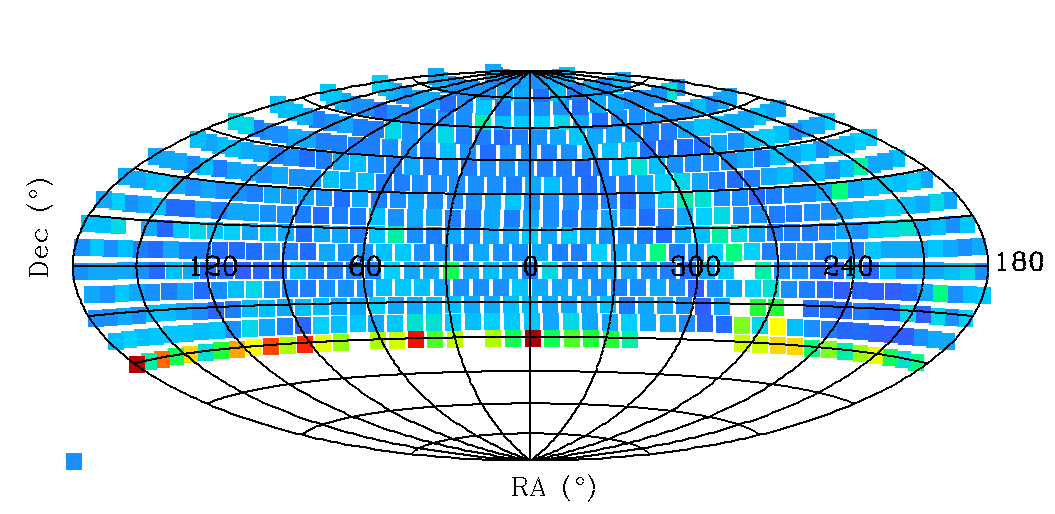
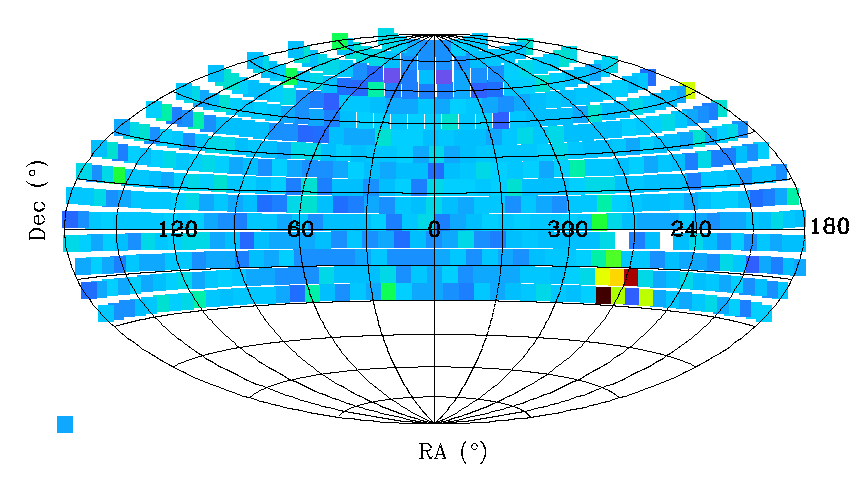
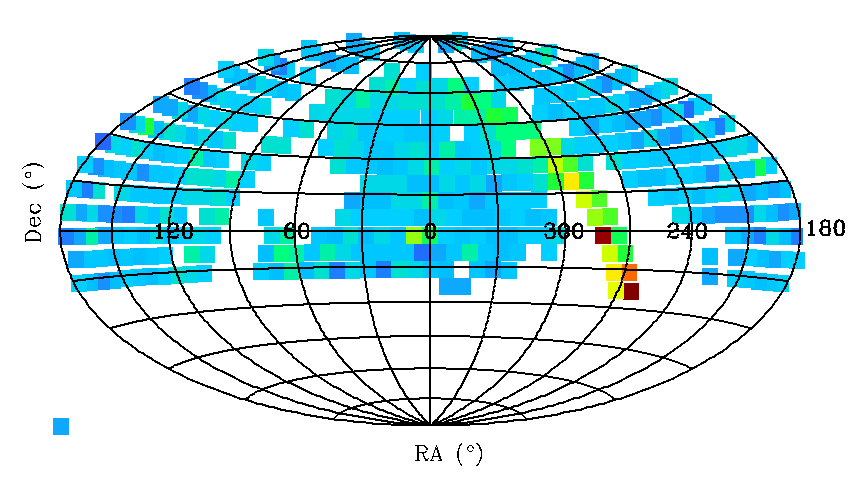
Spatial variation in source RMS for ZTF r-band sources.
Left current calibration, right Zubercal. Top CCD6 q4,
bottom CCD 11 q2.
In the plots above see show the RMS for ZTF r-band observations. Here we see that the current r-band photometric calibration is better than g-band. However, the results for CCD 11 are still better than CCD 6. Some regions of high RMS are observed. The structure mirrors the variation in r-band colour coefficients. In particular the Aitoff spatial plot. This effect was found to be correlated to extinction. Since our model for do not include extinction, it is likely that the photometry can me improved by determiningg and applying an extinction correction.
Note the extinction was not included in the Zubercal fits since it is poorly constrained on nights when no low Galactic latitude fields are observed. Additionally the values of extinction are not well known. However, assume the Galactic reddening law is valid, it should be possible to correct.
CCD 6 quadrant 4
CCD 11 quadrant 2
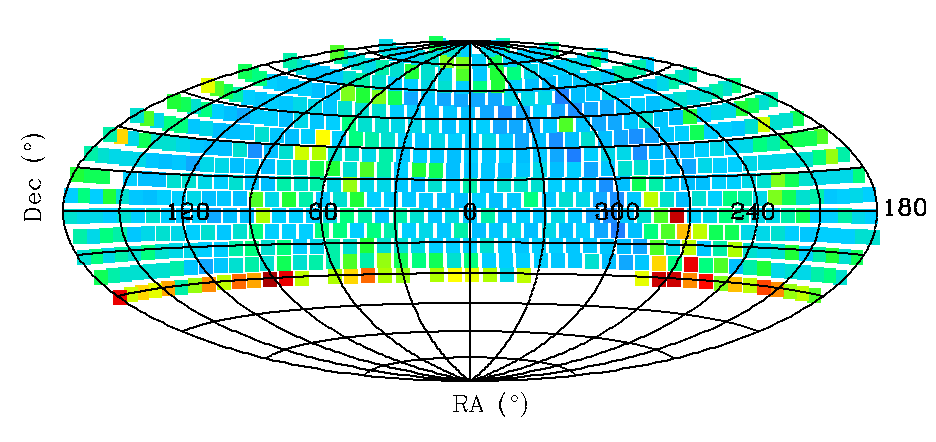
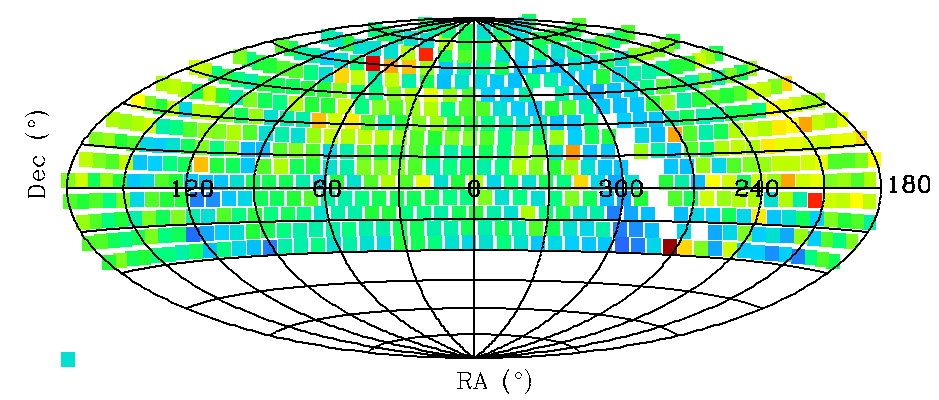
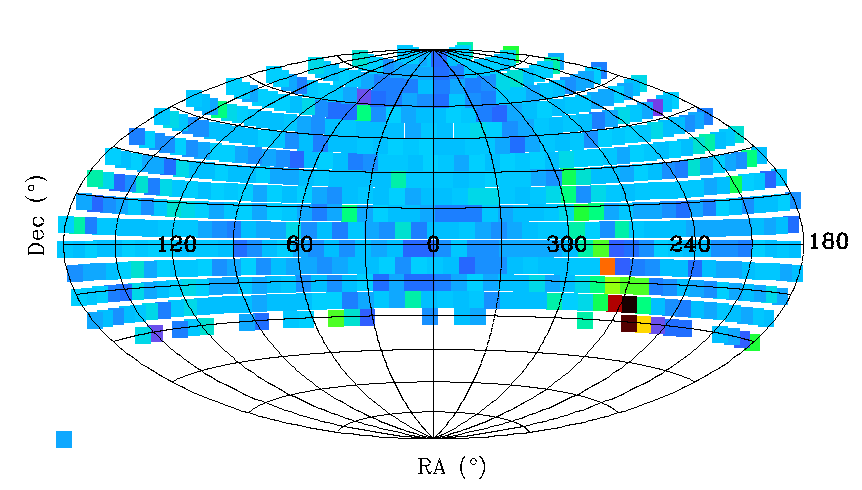
Spatial variation in source RMS for ZTF i-band sources.
Left current calibration, right Zubercal. Top CCD6 q4,
bottom CCD 11 q2.
In the plots above see show the RMS for ZTF i-band observations. The plots are similar to other bands. However, fields near the Galactic plane appear to have better accuracy. To some extent this is likely to be due to their being much less extinction in i-band.
Variations between ZTF and PS1 photometry
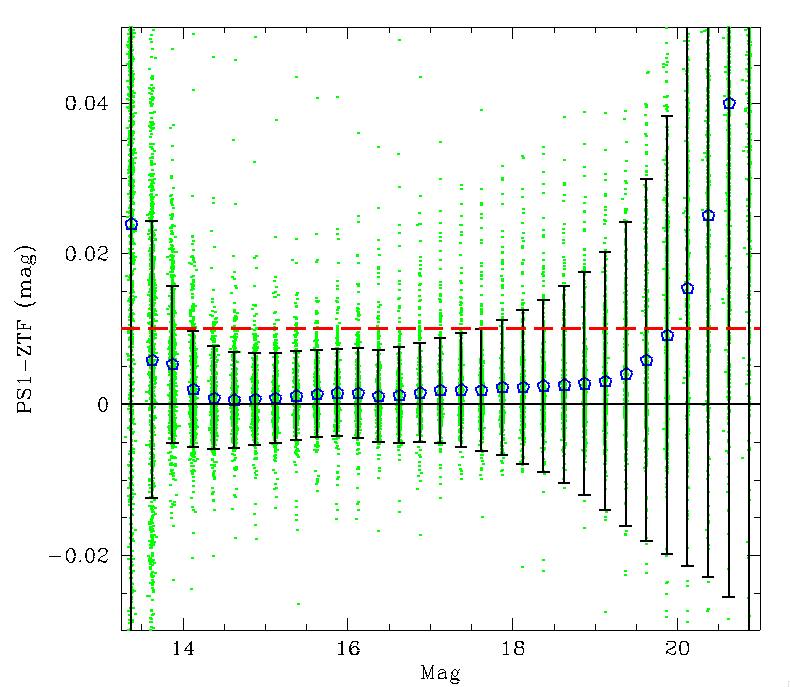
The plots above show that the relative calibration of ZTF is much improved with Zubercal. However, we also need to know how good the absolute calibration is compared to the PS1 calibrator sources.For each star in each ZTF field and quadrant, we determine the difference between the ZTF median magnitude and the PS1 magnitude. As above we bin sources for each field in 0.25 magnitude bins.

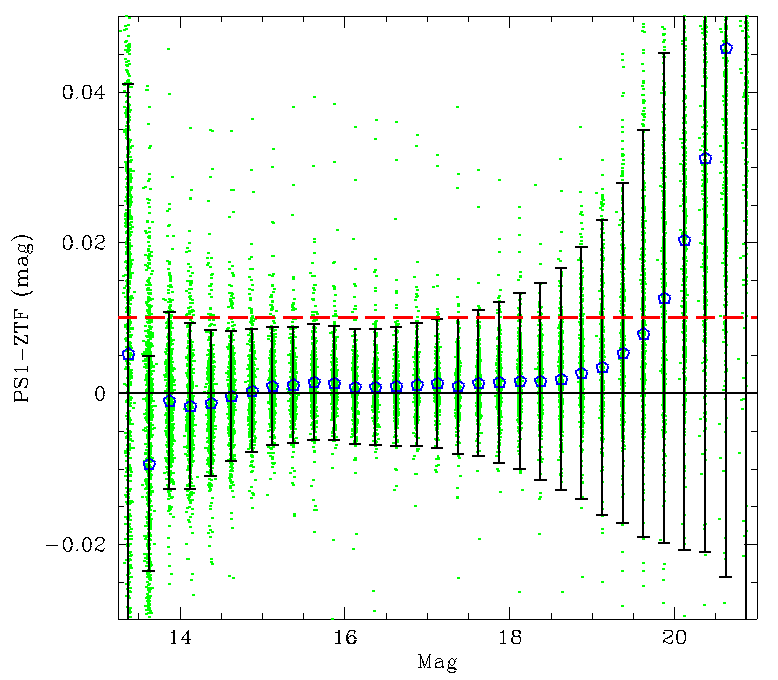
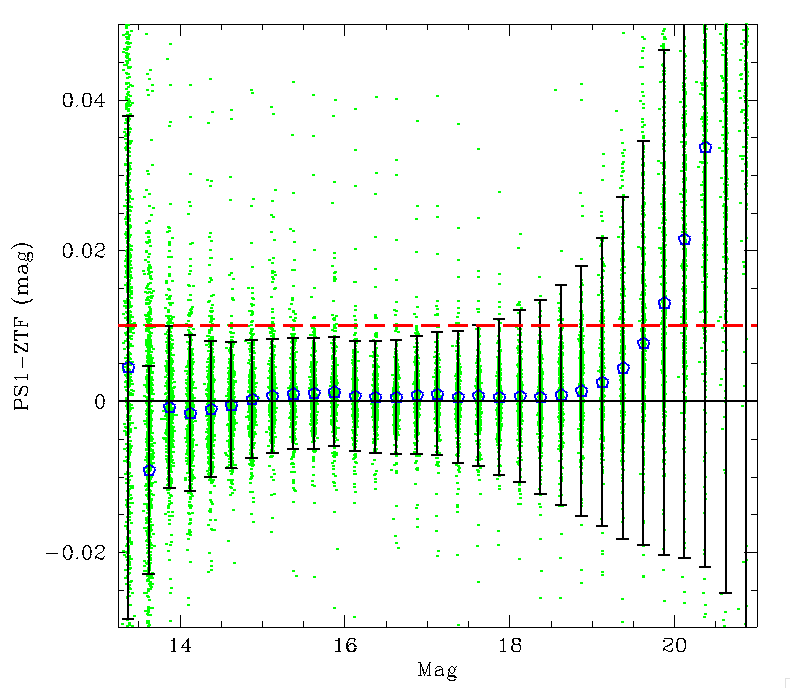
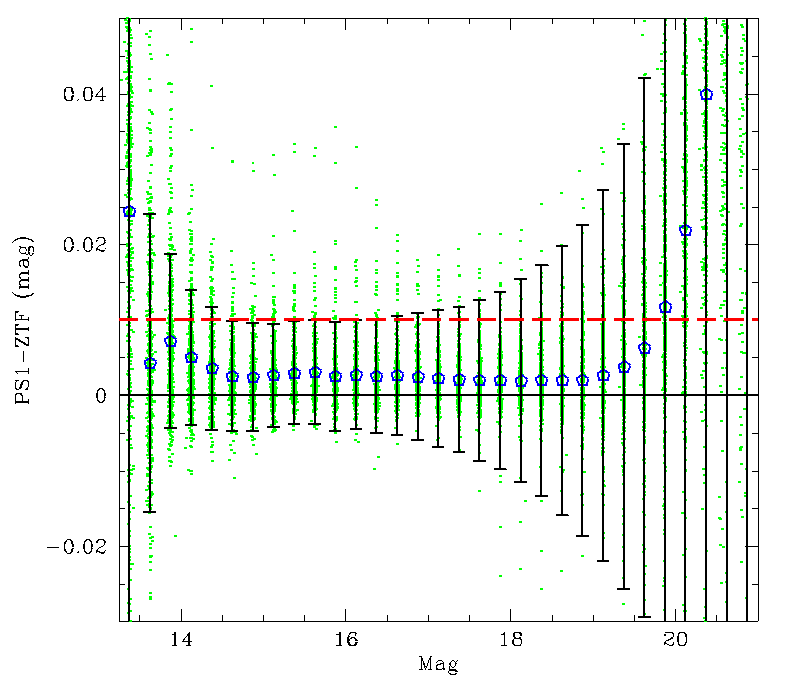
ZTF g-band variations between Zubercaled magnitudes and PS1 magnitudes for stars in CCD6,q4; CCD7,q3; CCD10,q1; and CCD11,q2, respectively. Blue pentagons show the average difference for all fields and each magnitude bin.
In the plot above we see that there is a slight systematic variations between ZTF and PS1 magnitudes. This is typically less than 5 millimags for sources 14 < mag < 19. Even with the systematics the errors in magnitudes across all fields is generally < 1%.
For brighter source saturation of PS1 leads to large variations. For fainter sources the Eddington Bias, along with differences in depth and blending with seeing and transparency lead to significant variations in measured median brightness.
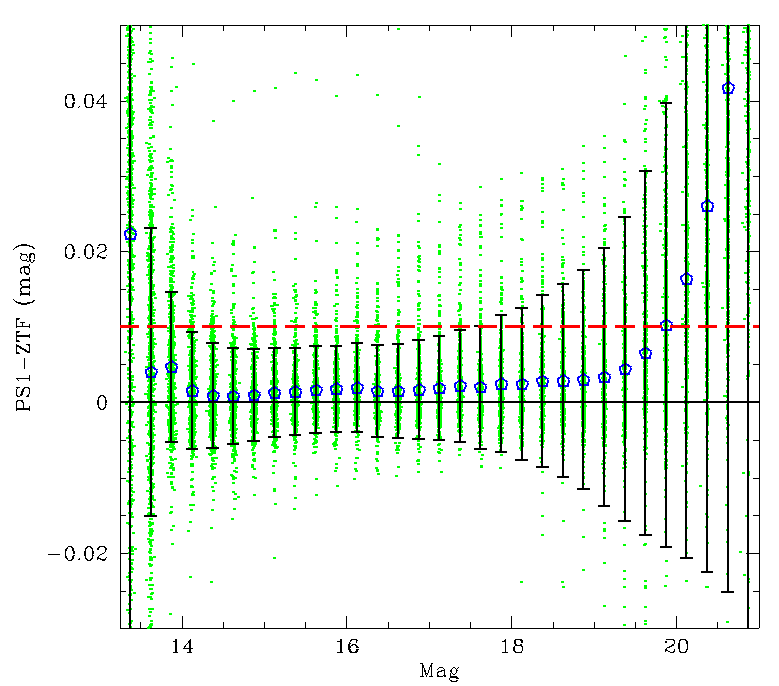
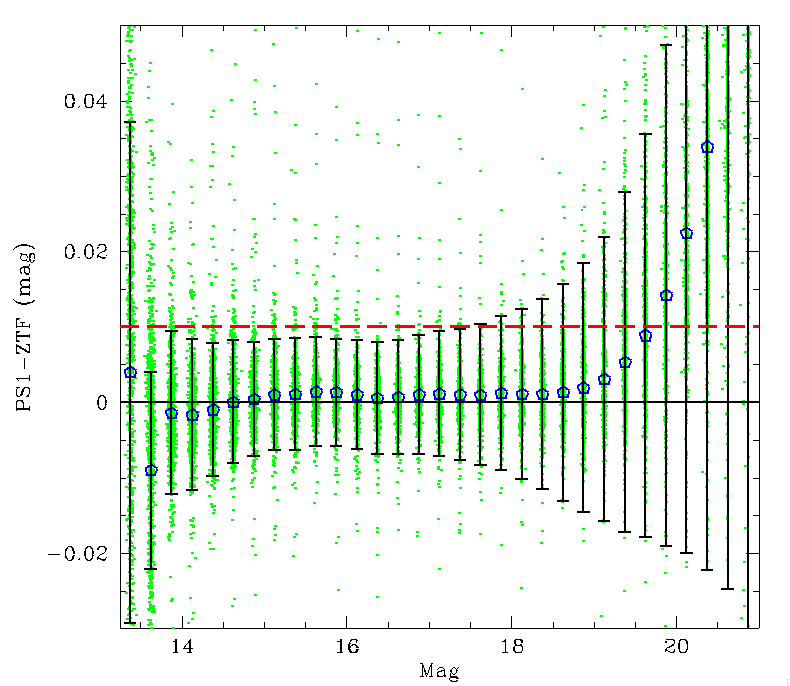
ZTF r-band variations between ZTF Zubercaled magnitudes and PS1 magnitudes for stars in CCD6,q4; CCD7,q3; CCD10,q1; and CCD11,q2, respectively. Blue pentagons show the average difference for all fields and each magnitude bin.
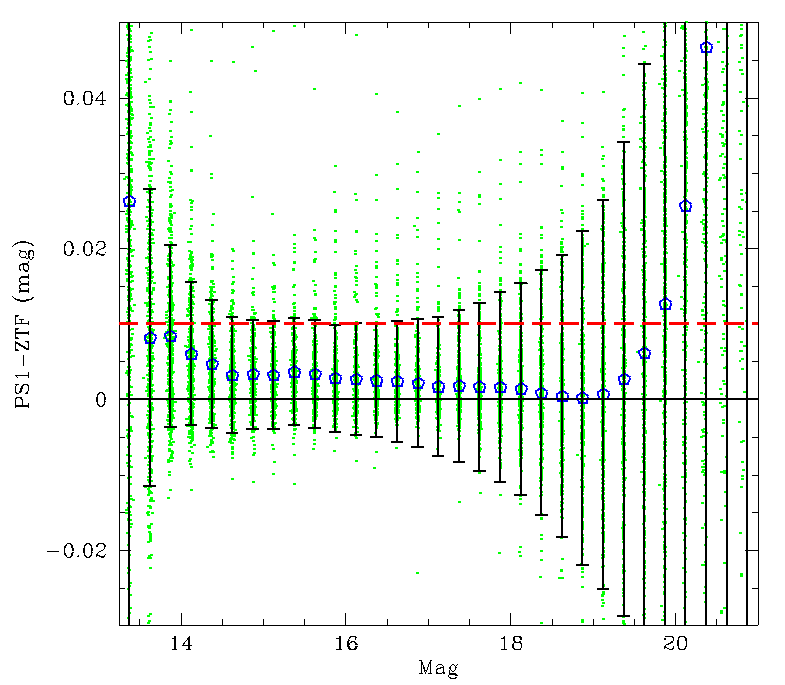

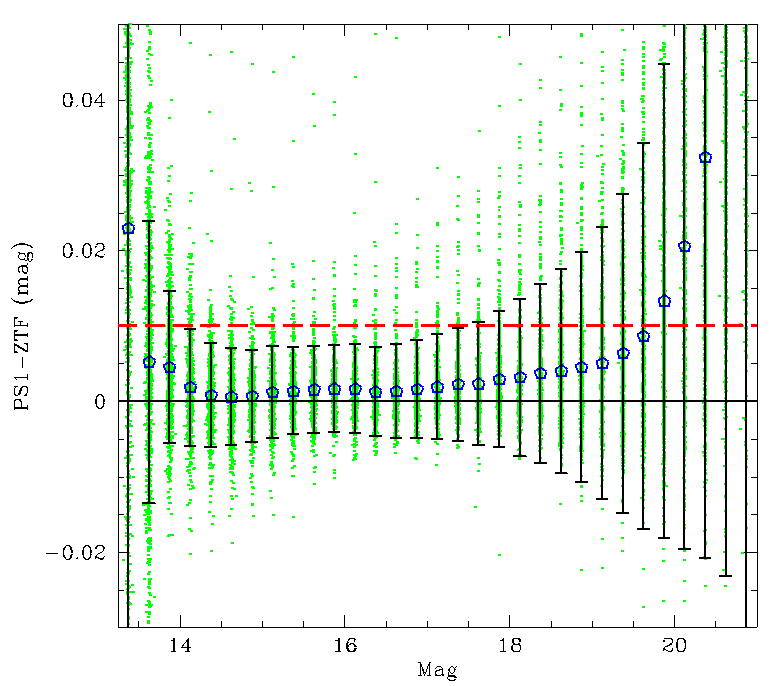
ZTF i-band variations between ZTF Zubercaled magnitudes and PS1 magnitudes for stars in CCD6,q4; CCD7,q3; CCD10,q1; and CCD11,q2, respectively. Blue pentagons show the average difference for all fields and each magnitude bin.
For completeness we plot the results for r and i-band observations above.
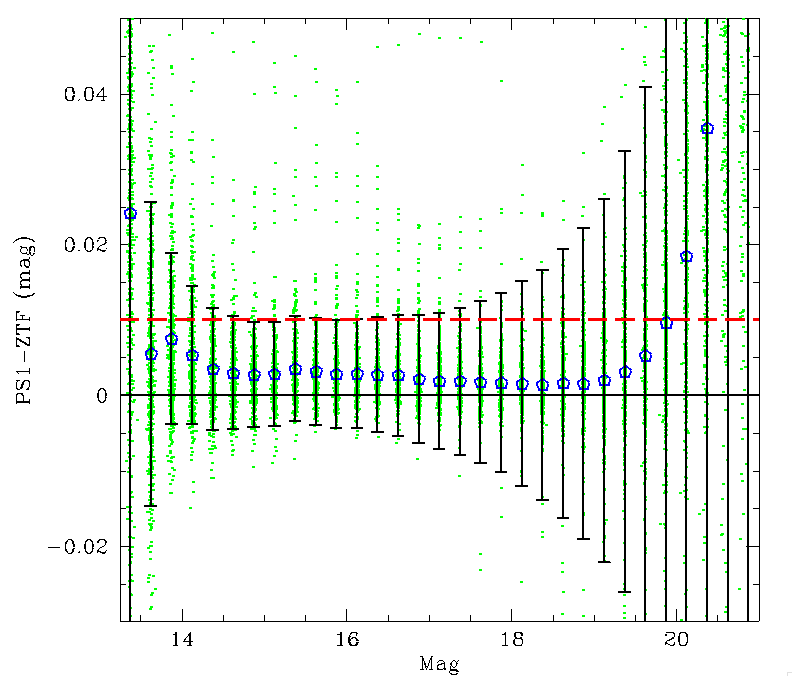
RMS uncertainties across filters
In the plots above we showed that systematic differences between Zubercaled ZTF magnitudes and PS1 magnitudes are only a few millimags. If we just look at the scatter of values within each field we get the following.
ZTF g,r and i-band differences between ZTF Zubercaled magnitudes and PS1 magnitudes for stars in CCD11, quadrant 2. Blue pentagons show the median RMS for all fields and each magnitude bin.
In the plot above we see that the RMS differences between ZTF and PS1 are less than 1% in CCD11 quadrant 2 between mags 14 and 18. That is to say the median magnitudes of ZTF sources in this range are very well calibrated to PS1.
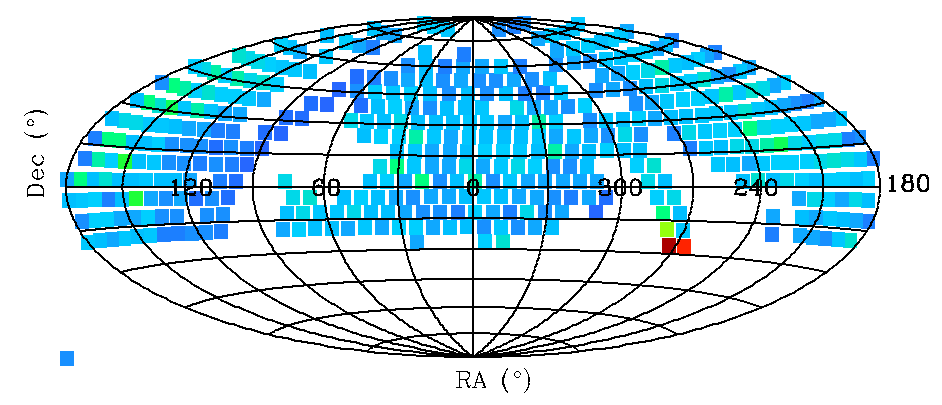
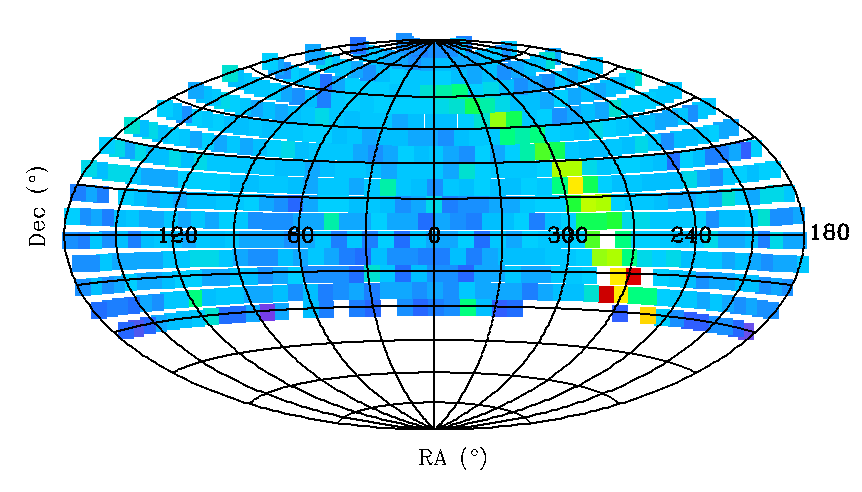
Spatial Structure of photometric difference between ZTF and PS1
In order to better understand the presence of photometric spatial systematics we plot the difference between ZTF and PS1 magnitudes for sources in the range of 15 < mag < 16 (the most accurate level).
CCD 6 q4, CCD 7 q3
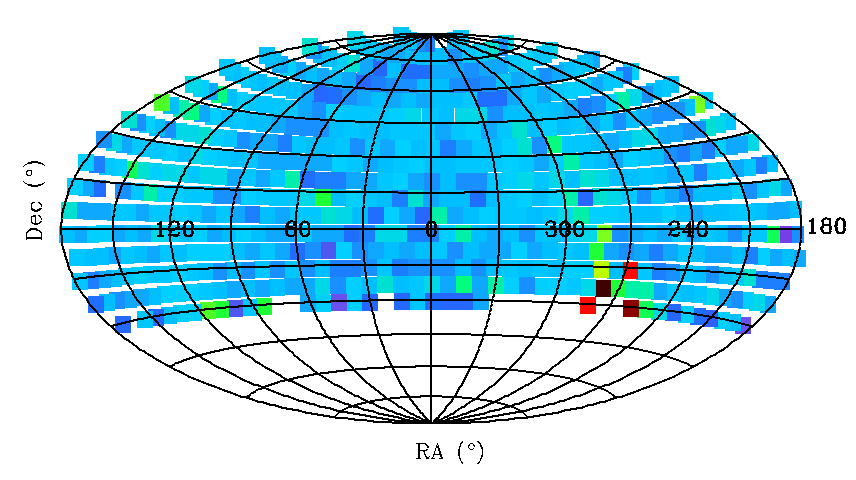
CCD 10 q1, CCD 11 q2
Spatial variation in difference between ZTF and PS1 photometry for
g-band stars. In the top two plot we show sources falling
in CCD6
quadrant 4 and CCD7 quadrant 3, and in the bottom CCD 10 quadrant 1
and CCD 11 quadrant 2.
In the four g-band quadrants above we see little evidence of spatial structure.
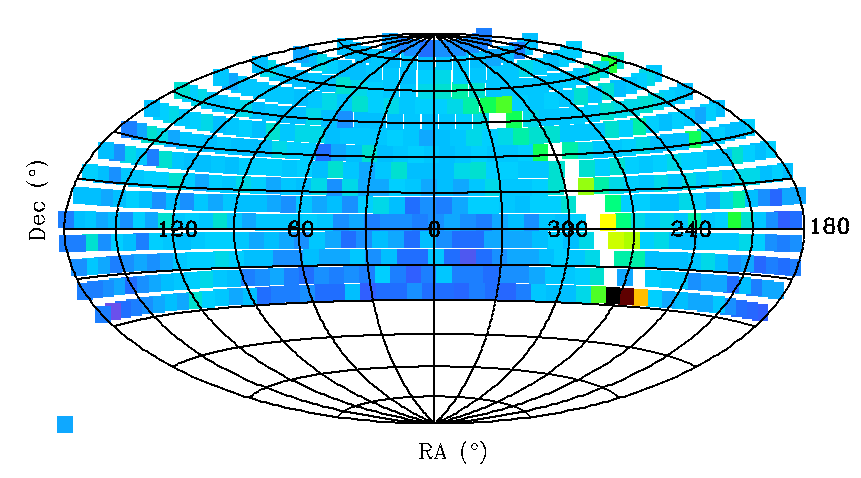
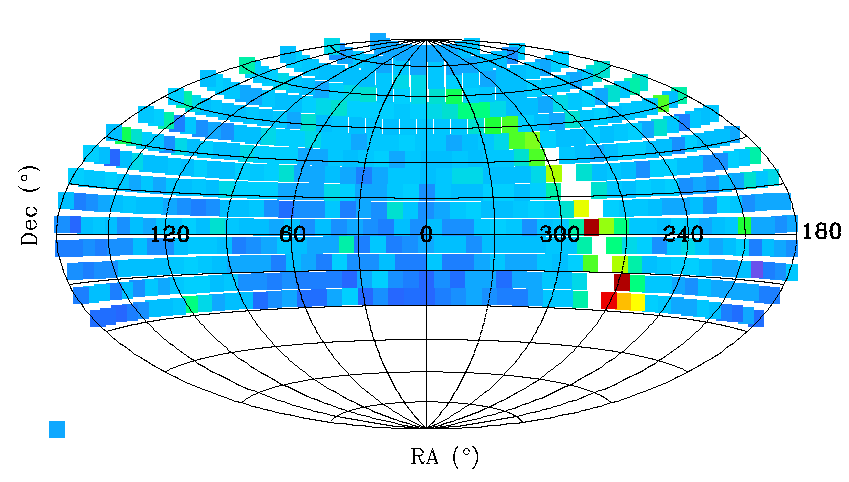
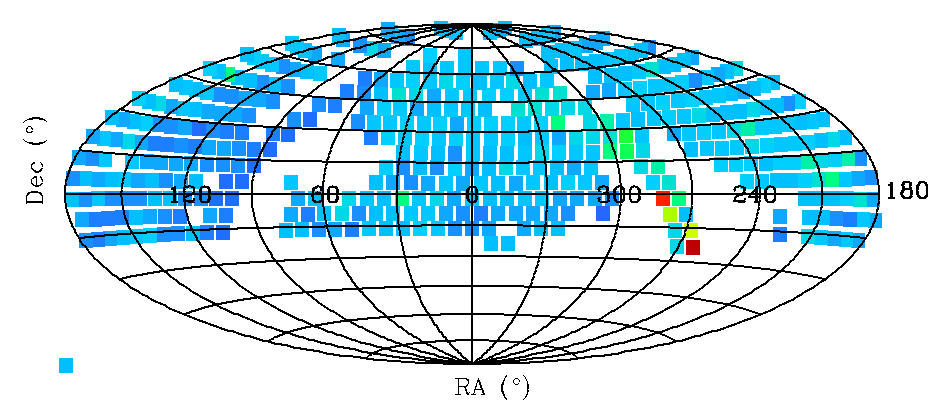
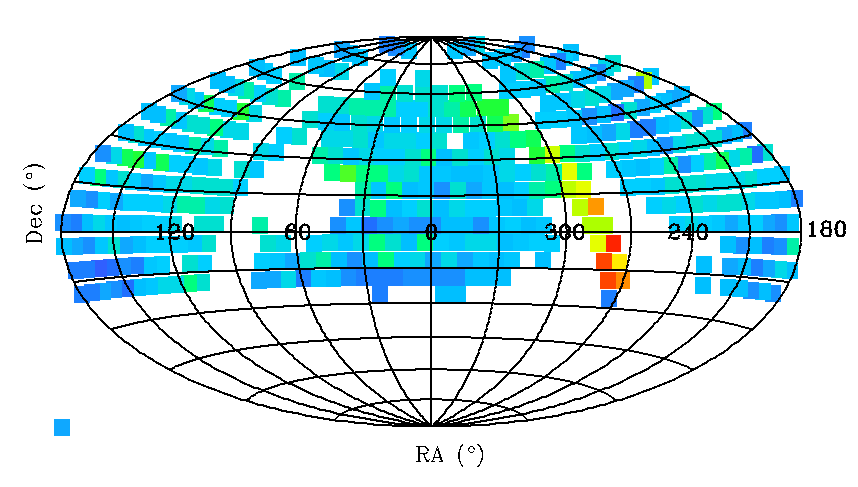
CCD 6 q4, CCD 7q3
CCD 10 q1, CCD 11 q2
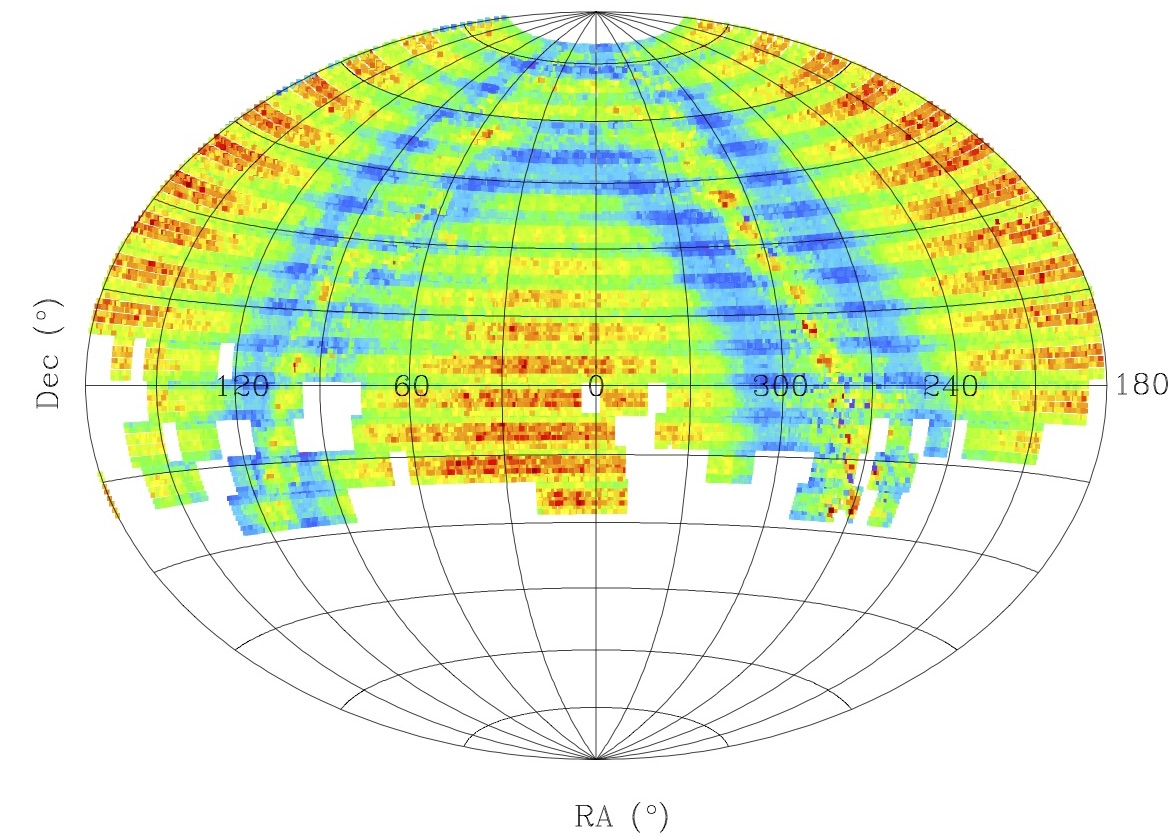
Spatial variation in difference between ZTF and PS1 photometry for
r-band stars. In the top two plot we show sources falling
in CCD6
quadrant 4 and CCD7 quadrant 3, and in the bottom CCD 10 quadrant 1
and CCD 11 quadrant 2.
In the four r-band quadrants above we see signficant evidence for spatial structure in the Galactic plane. This once again suggests a reddening bias. The fact that there is less structure in g-band is interesting since reddening is larger. However, this may be just be symptomatic of the ZTF g-band being more similar the PS1 filter than the r-band (there is less reddening in ZTF r-band observations).
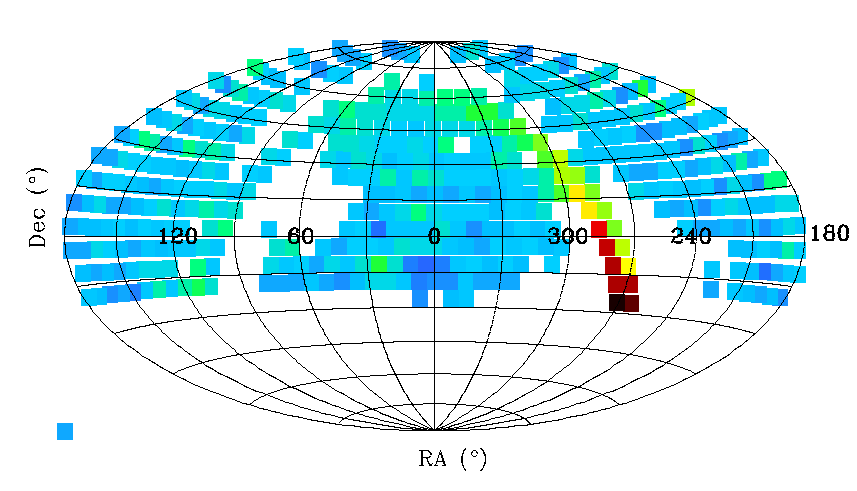
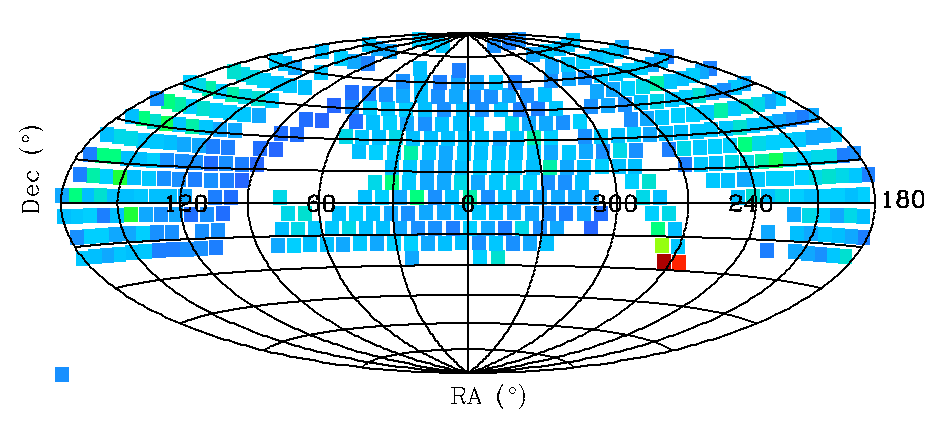
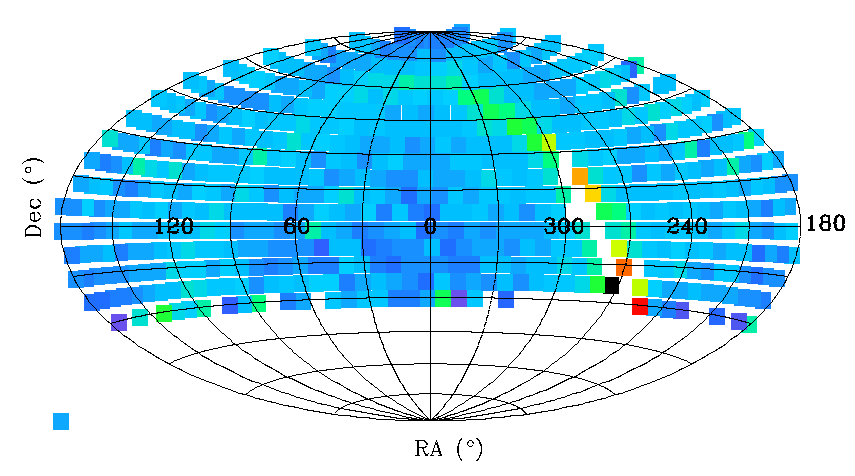
CCD 6 q4, CCD 7q3
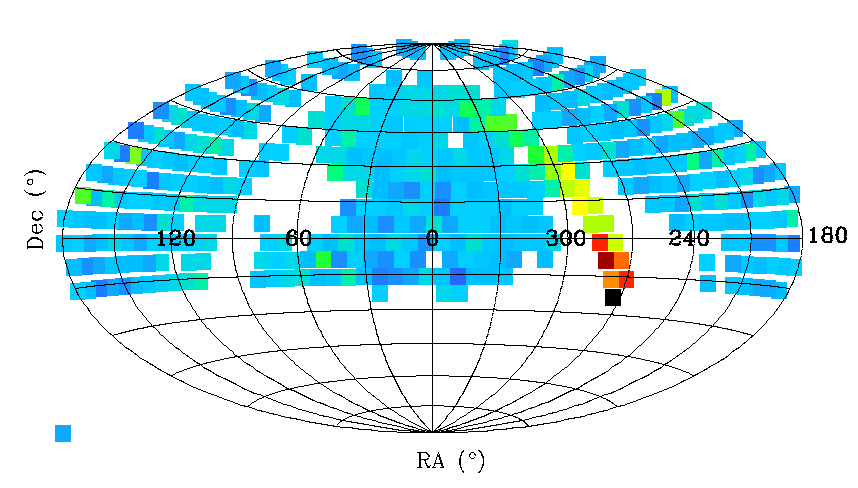
CCD 10 q1, CCD 11 q2
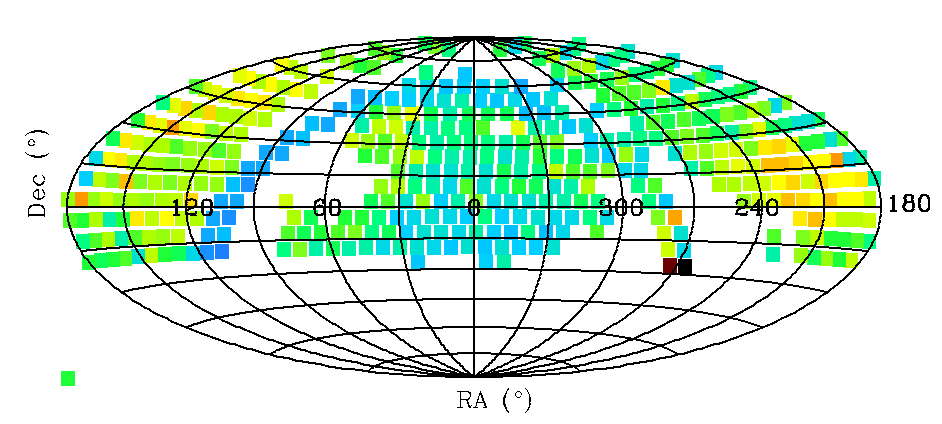
Spatial variation in difference between ZTF and PS1 photometry for
i-band stars. In the top two plot we show sources falling
in CCD6
quadrant 4 and CCD7 quadrant 3, and in the bottom CCD 10 quadrant 1
and CCD 11 quadrant 2.
As with the r-band data we see a systematic differences between PS1 and ZTF i-band observations within the Galactic plane. Once again this is likely due to ZTF undergoing less extinction since it is redder than PS1 i-band.
Discussion
We have presented the results from analysis of four quadrants of Zubercaled photometry near the center of the ZTF camera. We find that median RMS uncertainties reach the desired minimum of 1% for stars with mags ~ 15. This is a significant improvement over the existing ZTF photometry. We further find that there are systematic difference between ZTF median magnitudes and PS1 magnitudes that are typically less than 5 millimags. These uncertainties are larger for bright stars (that are saturated in PS1) and faint stars that are affected by Eddington bias.Additonally, the systematics are larger in r and i-band data within the Galactic plane due to difference between PS1 and ZTF filters. We expect that simple corrections for reddening can be applied to remove much of this difference. However, the level of photometric accuracy in such fields is likely limited by how well reddening is actually determined and where the sources lie along the line-of-sight relative to the dust disk.
Away from the Galactic plane, where SN cosmology is undertaken, median systematic differences between ZTF and PS1 are < 1% for sources with mag < 20.