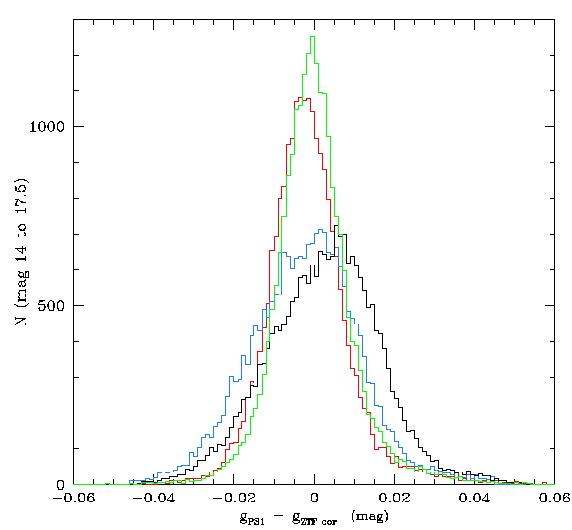
Binned differences between the ZTF g-band and PS1. The black line is the original calibrated data. The blue line is corrected for the magnitude dependence. The red line is corrected for the spatial structure. The green line is after systematic offsets between each field and PS1 are removed.
After correcting for the magnitude dependence and the spatial dependence (as noted eariler), it became clear that the resulting residuals were not exactly centered on zero. As shown above there was a slight offset (~0.002 mags, red line).
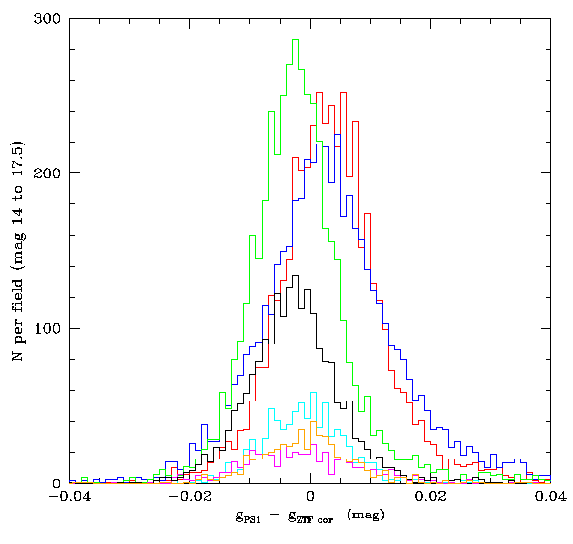
Binned differences between ZTF and PS1 mags for corrected individual fields and bright (g < 17.5) sources.
Closer inspection of the individual fields showed systematic offsets wrt to PS1. This is offset was found to be up to 0.005 mags. Correcting each of the input fields for this offset further reduces the final observed scatter for the corrected photometry.
The sigma of the resulting residuals wrt PS1 (for sources with g < 17.5), after the magnitude and spatial corrections and field offset is ~0.007 mags (c.f. 0.008 without).
Determining systematic offsets for all ZTF fields
To correct for systematic offsets between ZTF and PS1 we obtained photometry for all ~300 million ZTF bright (mag < 18) stars. These data were matched with full PS1 DR1 combined catalog. The ZTF photometry was first corrected for the quadrant level magnitude biases and the median calibration colour coefficents required to match ZTF to PS1. Finally, the offsets between ZTF median mags and PS1 combined mags were calculated for every quadrant in every ZTF field with data.
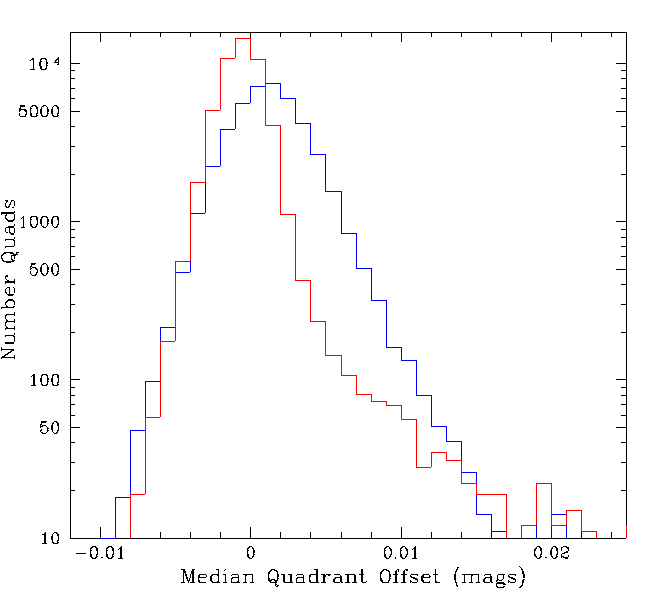
A histogram g and r-band ZTF magnitude offsets wrt PS1 g and r-band mags on a per quadrant basis. The blue histogram gives the g-band offset mag distribution. The red lines gives the r-band offset mag distribution.
Overall we find that the g-band data exhibits larger offsets than the r-band data. This may simply be reflective of the fact that the residuals are larger in g-band data (as noted above). The field offset distributions have sigificant tails due to some regions having large offsets.
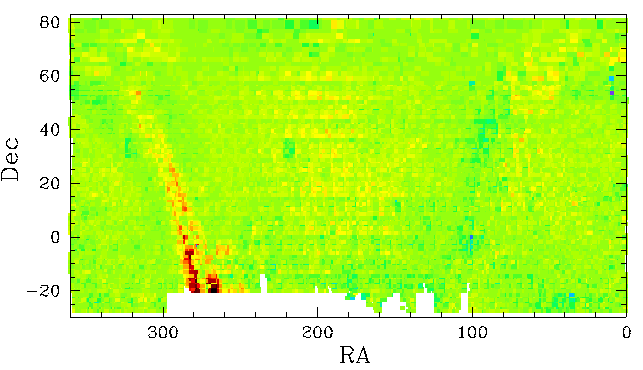
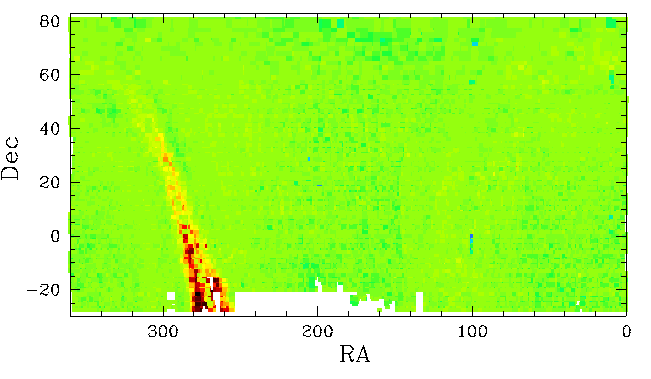
The observed distribution of offsets between g and r-band
ZTF magnitude and PS1 for all (regular grid) ZTF field. The left plot
gives the g-band offsets and the right gives the r-band offsets.
The colour limits of the plot are approximates +/- 0.02 magnitudes.
White regions have no offset values as the quadrant photometry is
missing from the ZTF data.
The observed plots of photometric offsets compared to PS1 show some significant systematics. These are particularly evident in the Galactic plane. This is most likely linked to crowding effects. The g-band data shows some larger offsets in sparse fields away from Galactic plane. This is probably due to poorer calibration due to a lack of calibrators (as mentioned elsewhere). A few isolated groups of quadrants that are far from the Galactic center also show large offsets in both g and r-band (for example near RA=100 deg, Dec=0 deg).
Conclusions:
Many ZTF fields show significant offsets at the quadrant
level when compared to PS1. The main source is likely to
be the number of sources within a field. Too few sources
lead to poor calibatration (see below). Too many lead
to crowding effects due to difference in the observed
resolution. Both PS1 and ZTF likely suffer from this
to a different extent.