| Topics |
|---|
| Photometric Residuals by Calibration Step (CCD13). |
| Comparison with g-band data from CCD 5. |
| Comparison with r-band data from CCD 6. |
| Discussion. |
Photometric Residuals by Calibration Step and Source Brightness
Following our prior calibration work on determining the underlying systematic residuals based on location and colour, as well as correcting for structure within individual frames (due to variations in transmission), we now quantify the effect of the separate calibration steps.
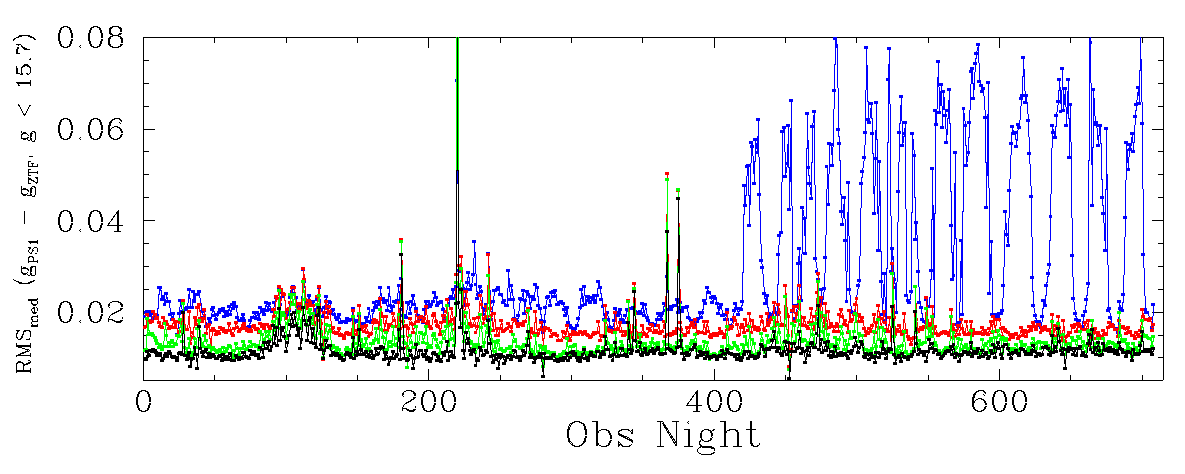
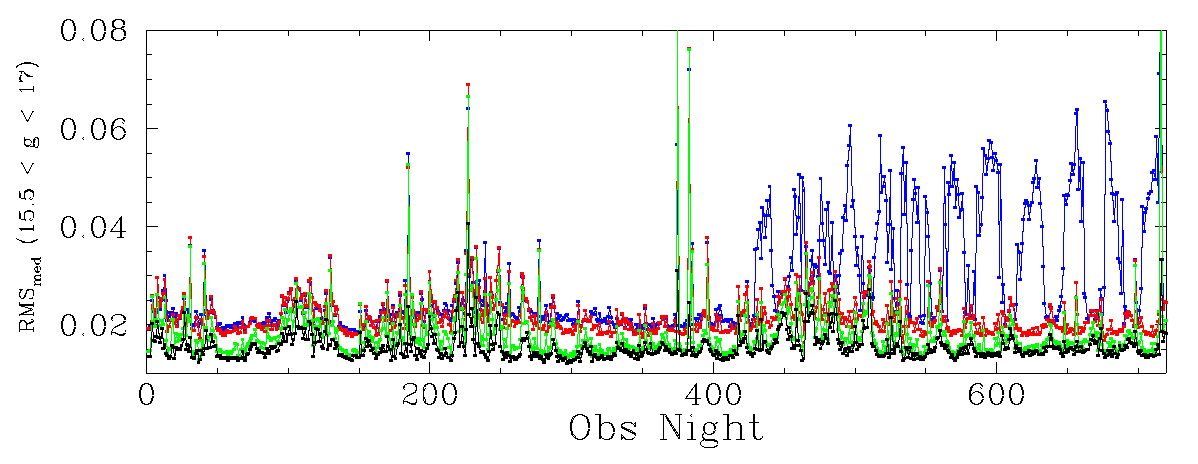
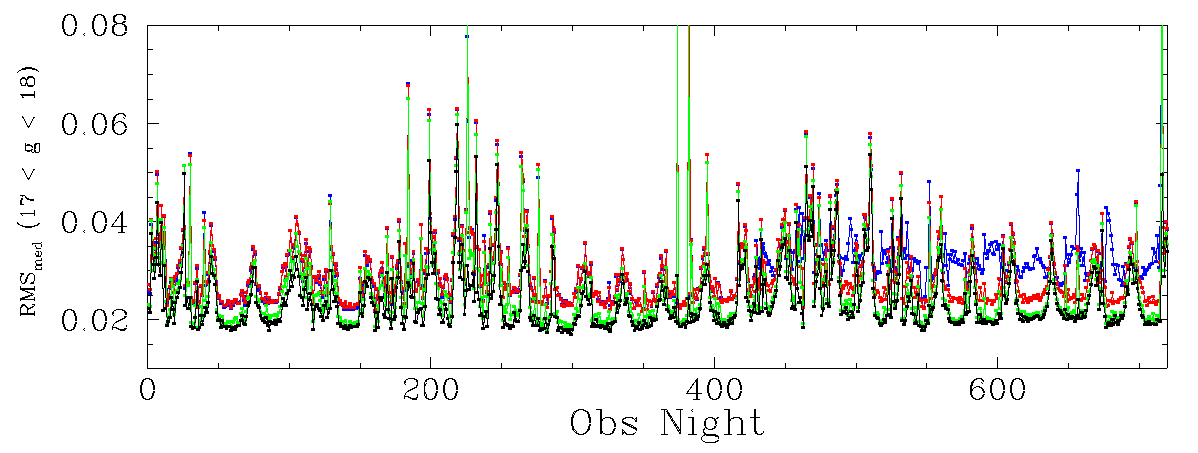
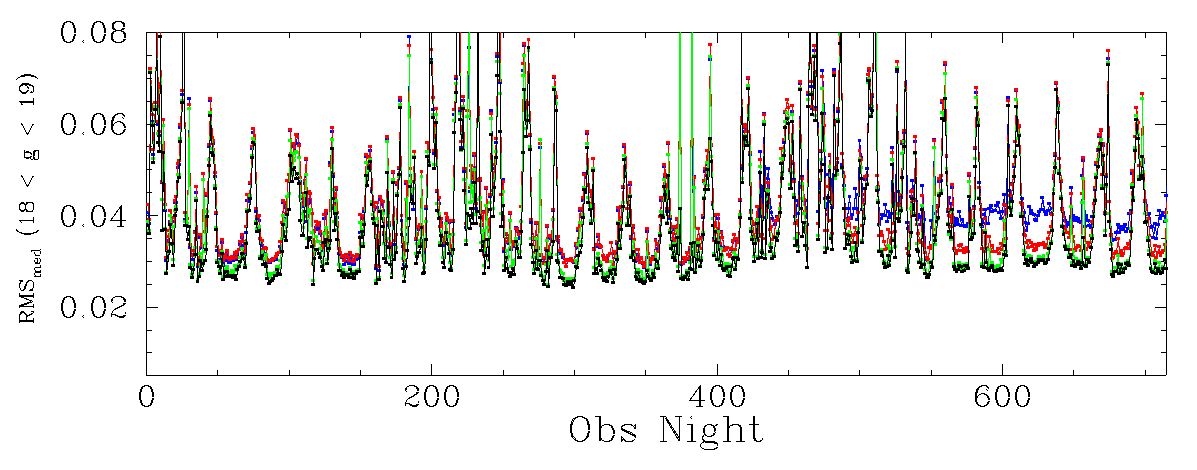
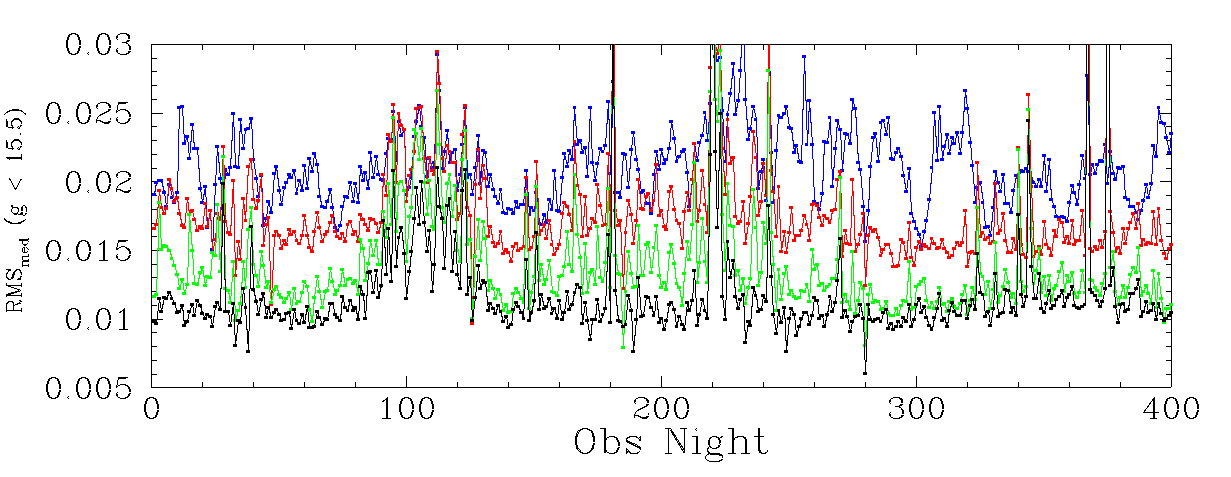
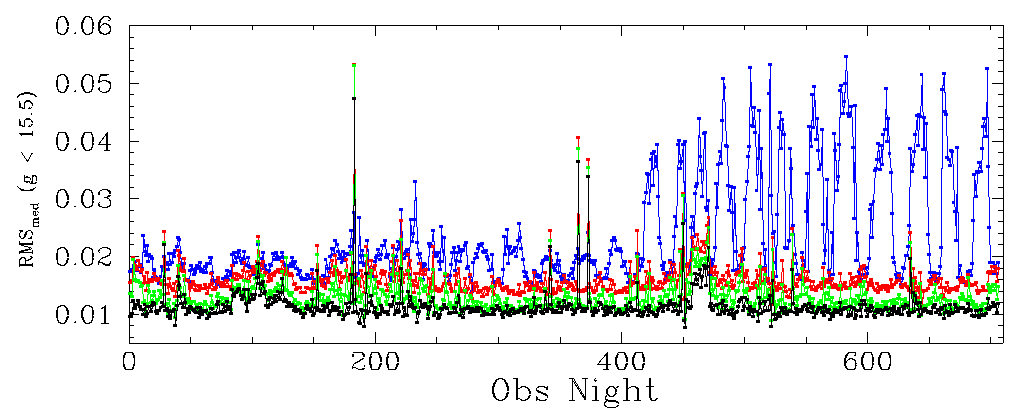
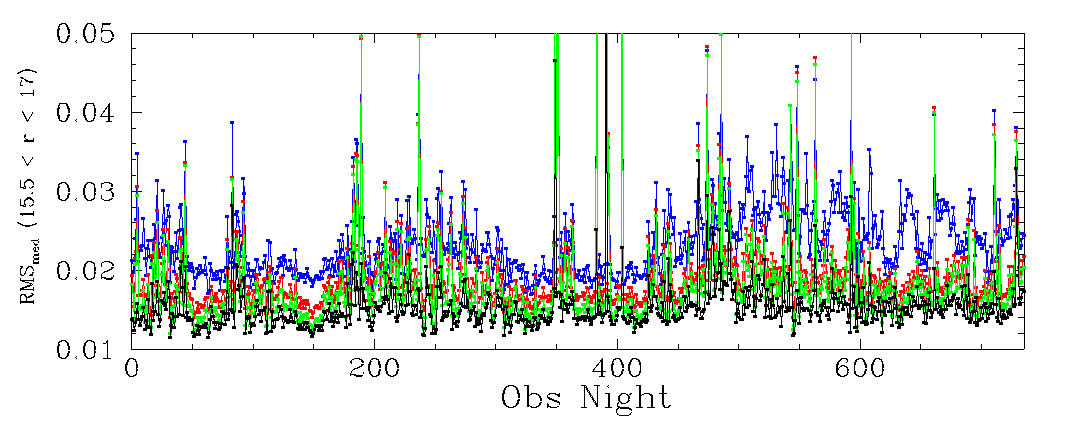
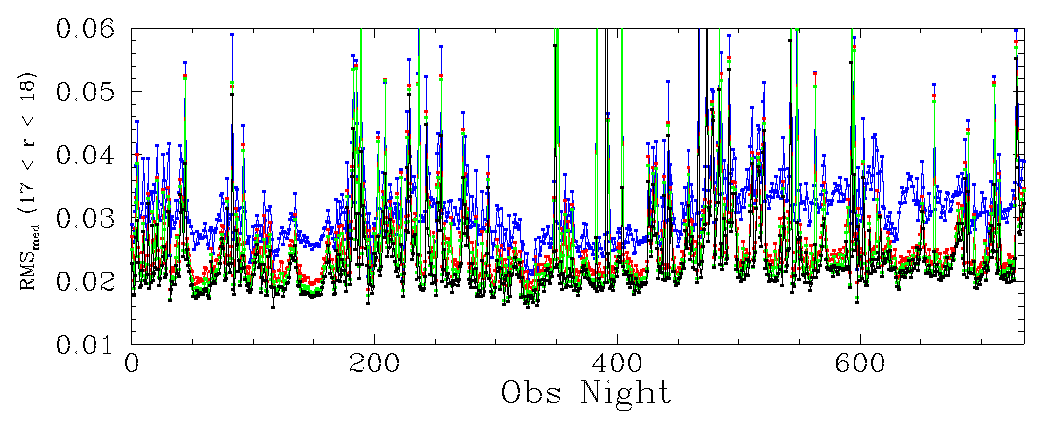
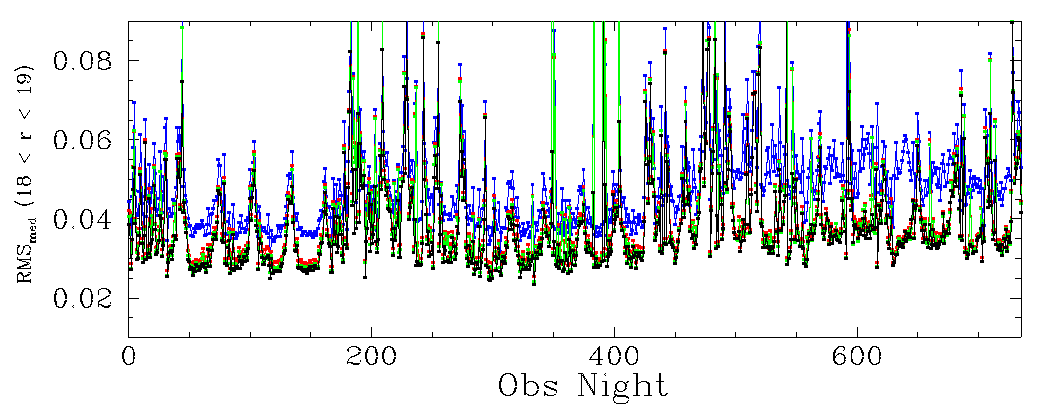
Median RMS of photometric residuals by observation night for CCD 13 g-band data for sources of varying brightness. Each line gives a different calibration source. The blue points give the current ZTF calibration with colour coefficient but no others corrections. The red points give the initial Zubercal calibration. The green points give the values when corrected for spatial structure and colour offsets. The black points give the residuals when corrected for fits to transparency structure. The top to bottom plots are divided by source brightness range.
In the plots above we show the median RMS residuals for each night of ZTF g-band photometry calibrated to PS1. Each plot is divided by source brightness. The "Obs night" given above is the sequence of nights that have observations in g-band, not date or JD. Each lines presents the effect after different calibration steps. Overall we see that the steps significantly improve the calibration. In the top plot we see that the from night ~400 (2019-10-22) the residuals increase greatly for bright sources. This is due to a non-linear relationship between source brightness and flux. The effect is smaller at faint magnitudes since those sources are closer to the linear fit.
What we also see is that fainter sources are subject to spikes in residuals which are almost certainly due to increasing background noise with increasing lunar phase. Clearly lunar phase becomes a dominate factor for the faintest sources.
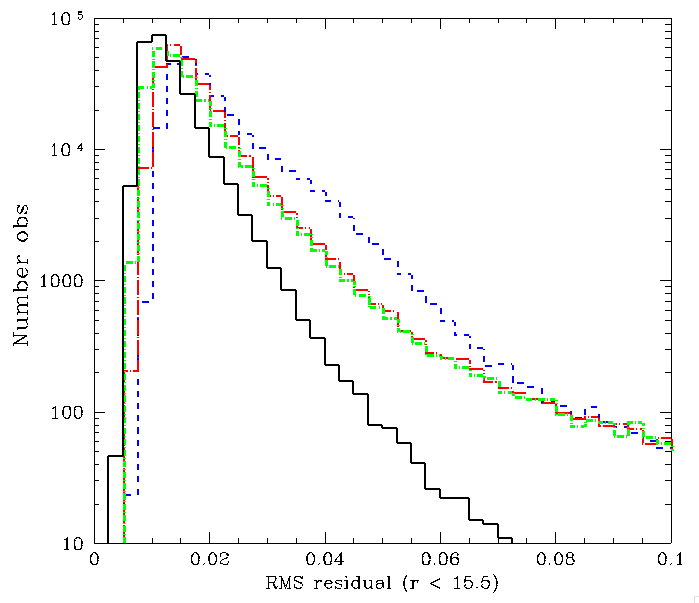
In the plot above we show an expanded plot to better demonstrate the improvement in calibration with each step using observations taken prior to the non-linear response.
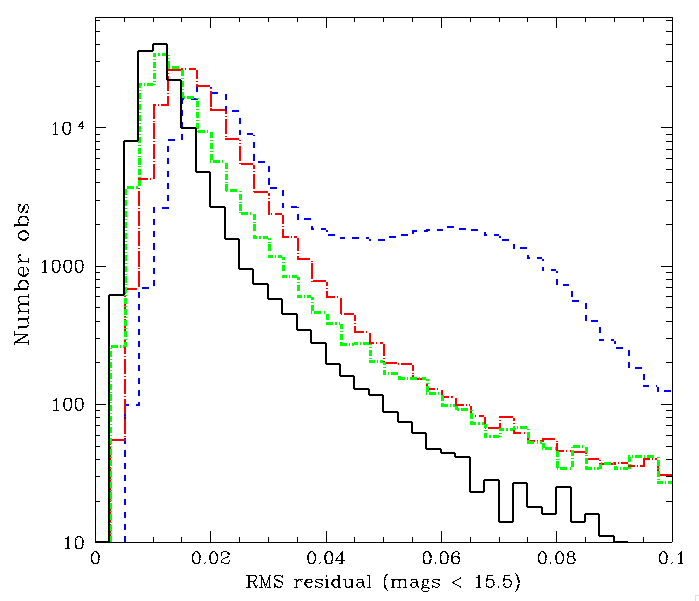
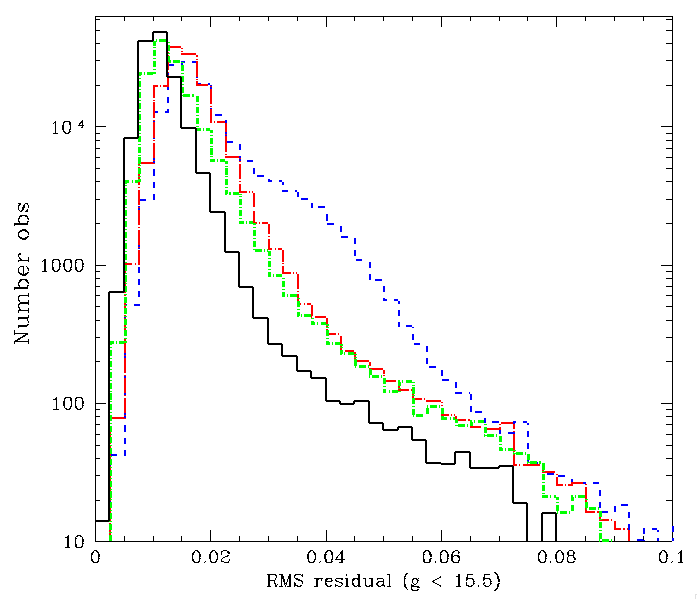
In the plots above we show histograms of the residuals of the ZTF g-band calibrated to PS1. For bright sources (g < 15.5) the peak of the RMS distribution shifts from ~2% to 1% after all calibrations are applied. We see that the spatial and colour-based corrections have little effect on images with the highest residuals, while this tail is significantly reduced by the individual frame fits.
Comparison with g-band data from CCD 5
Since CCD-13 is a corner CCD that was known to be affected by vigentting, a change in linearity, and likely PSF variations, we compare this with data from CCD-5.
Plots of median residuals for bright sources in CCD-5 from ZTF g-band data calibrated to PS1. Points colours are as noted above.
Histograms of photometric residuals for various calibration steps for all ZTF-I for all frames. Line colours are as noted above.
In the plots we see that the residuals after obs-day 400 show a significant increase as seen in CCD13. However, the level lower than in CCD-13. The calibrated fit residuals consistent with CCD-13.
Comparison with r-band data from CCD-6
To further understand how well the various calibration steps work we plot the results r-band data for CCD-6.
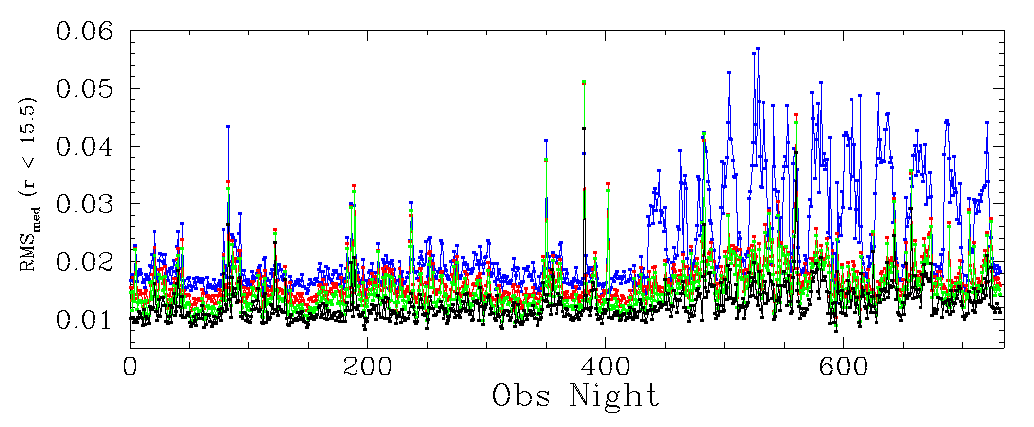
In comparison with the g-band data the initial and final calibrations in r-band are slightly better. In part this may be related to the photometry being less affected by the sky level. Unlike the g-band data, skylevel is not used in the Zuber calibration. The higher scatter in the later data (post-400, 2019-10-22), as well as faint sources, may suggest the need to include it in the model.
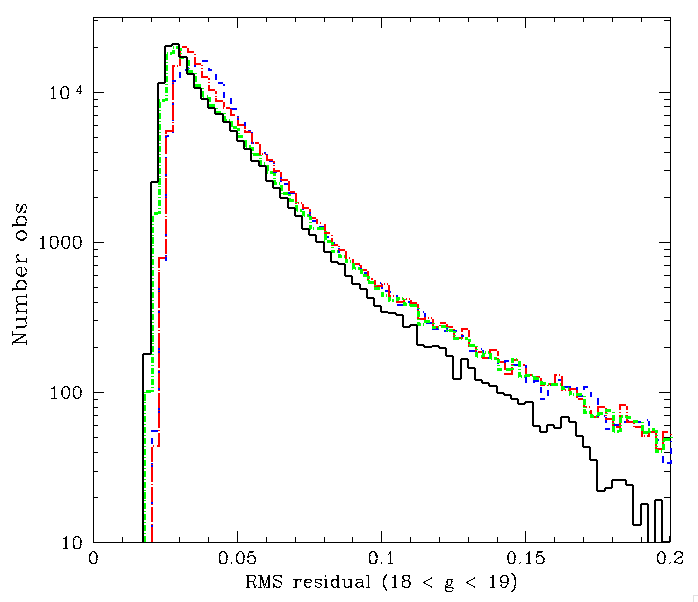
Histograms of photometric residuals in r-band CCD-6 for all frames. The lines colours are as given above.
In the plots above we see the scatter for bright sources in r-band. The results are very similar to g-band. We noted that there are many more r-band frames than g-band. There reduction is the tail of high scatter frames is very clear. The spatial structure in r-band is smaller than g-band, so the reduction with this correction is smaller.
Discussion
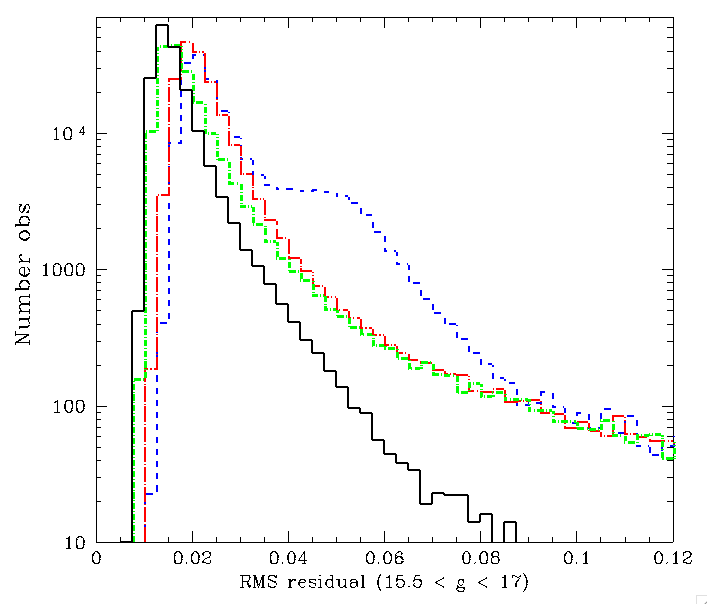
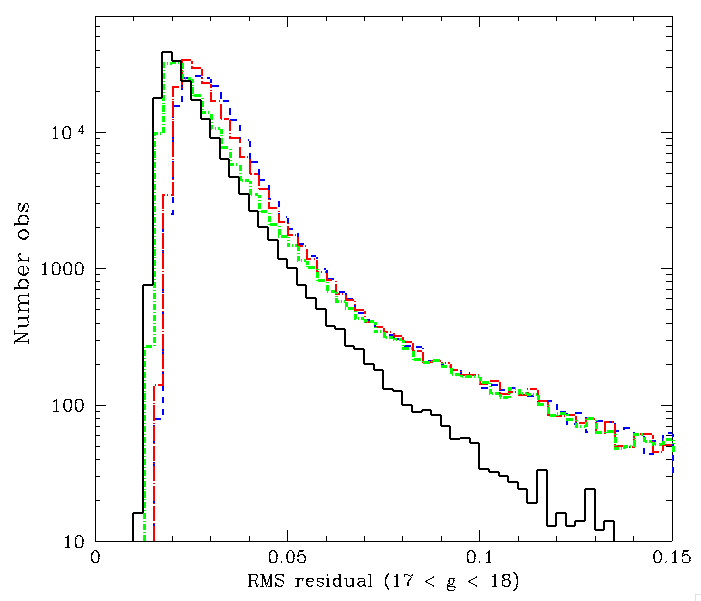
We have presented an analysis of the residuals for sources going through the Zubercal calibration steps. The current median RMS is now ~1% in both g and r bands for sources with mag < 15.5. We have provided separate plots for sources as faint as mag 19 (fainter sources are generally not used for calibration) since RMS increases with magnitude.For faint sources the noise limit is likely dominated by sky background in both g and r-band data. However, in r-band the noise level is reduced by the Zubercal process even for the faintest calibrator sources. It is worth considering whether it is possible to improve this data.
The Zubercal process makes a significant improvement for recent measurements of bright sources where the flux scale is strongly non-linear. This non-linearity is seen in all the CCDs analysed so far.
Further work is required to correct for the time dependence of the underlying spatial structure.
The analysis is based on ZTF calibrator stars. It is necessary to confirm these results based on scatter in the lightcurves of non-calibrators.