| Topics |
|---|
| Spatial structure in all frames. |
| The g-band dependence of residuals of source colour. |
| Discussion. |
Spatial Residuals based on all g-band calibrators
We undertook the inital steps in the Zubercal process for all ZTF g-band data. For each CCD we determine the average spatial resiudals following our prior work.
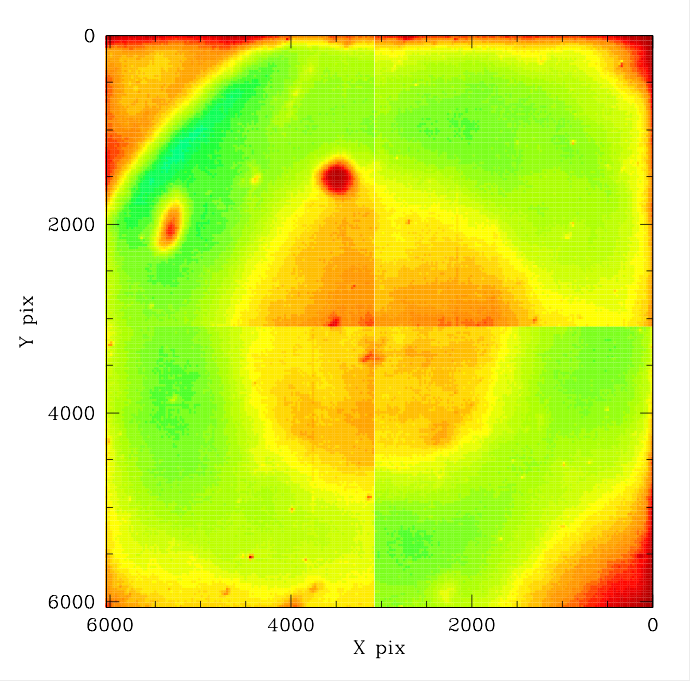
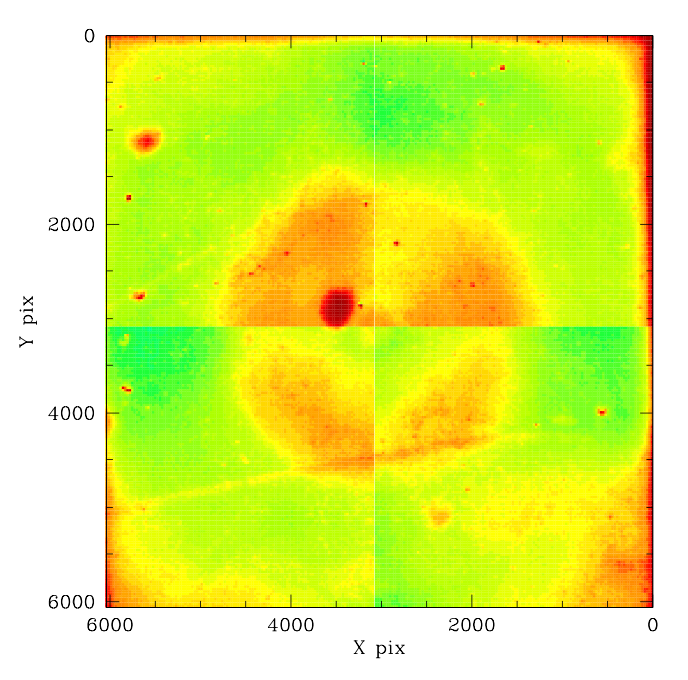
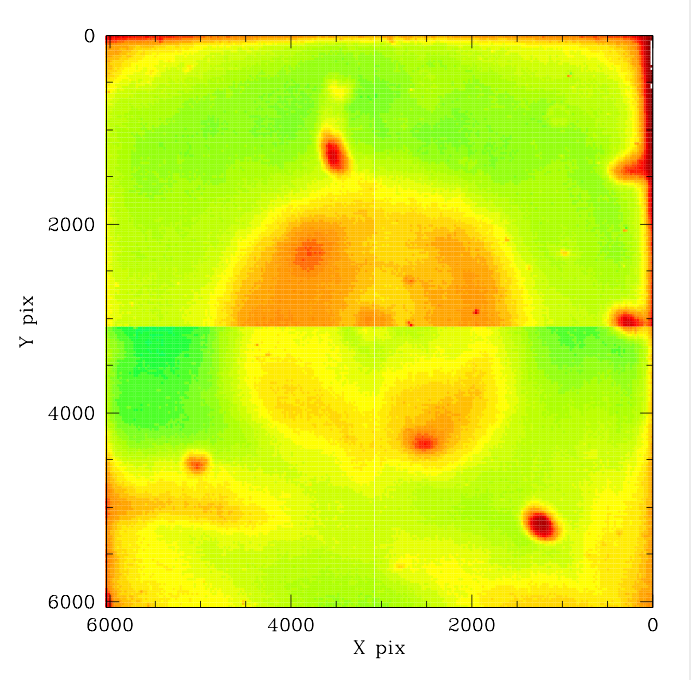
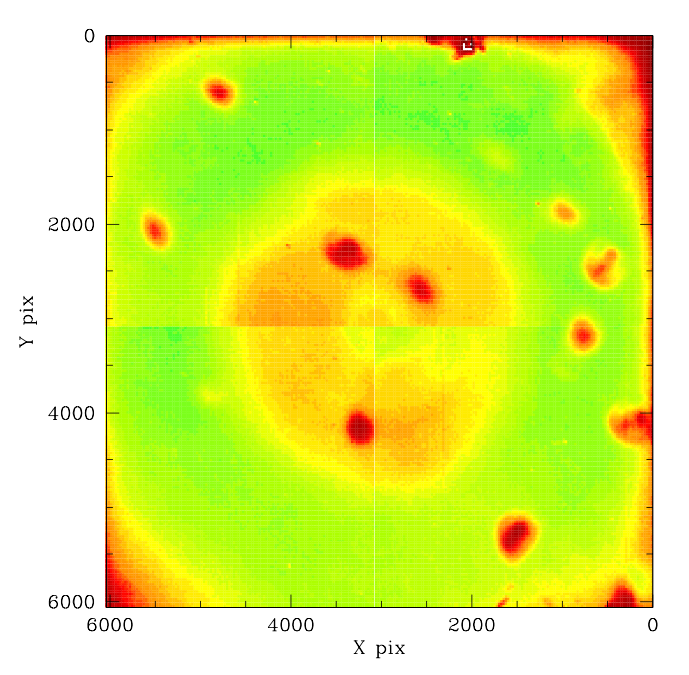
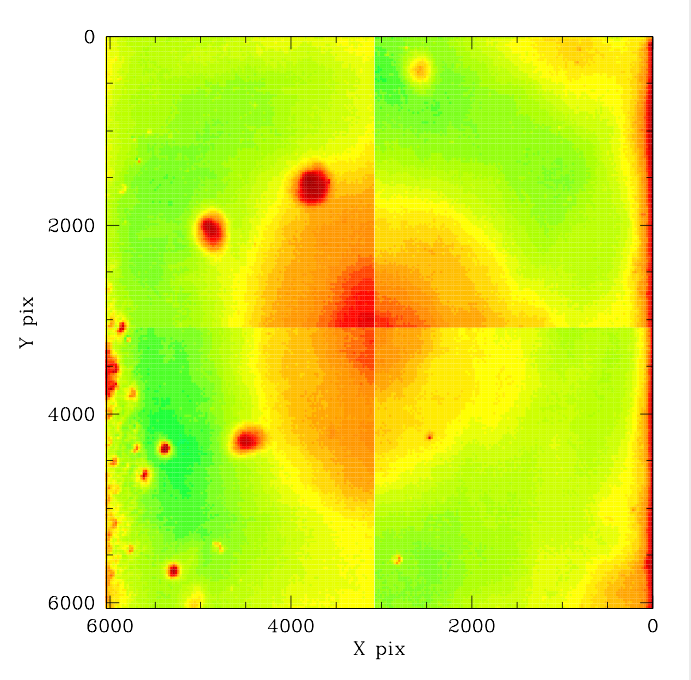
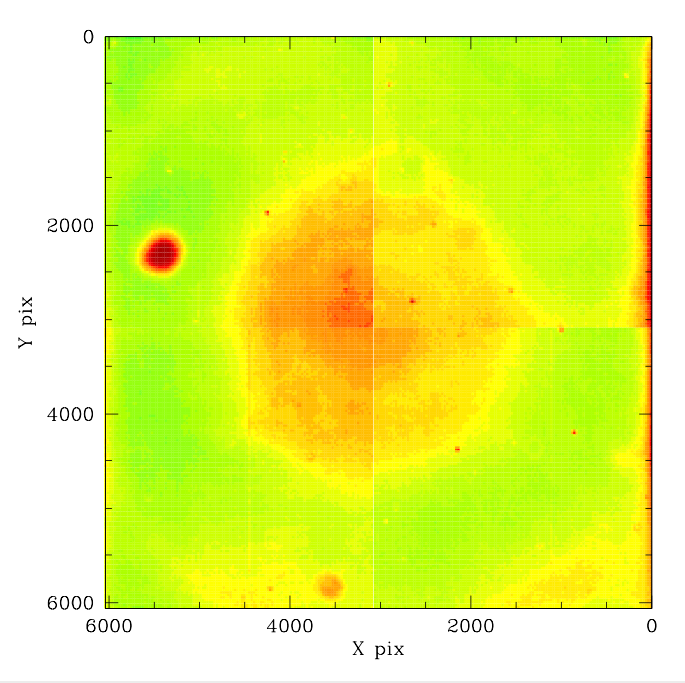
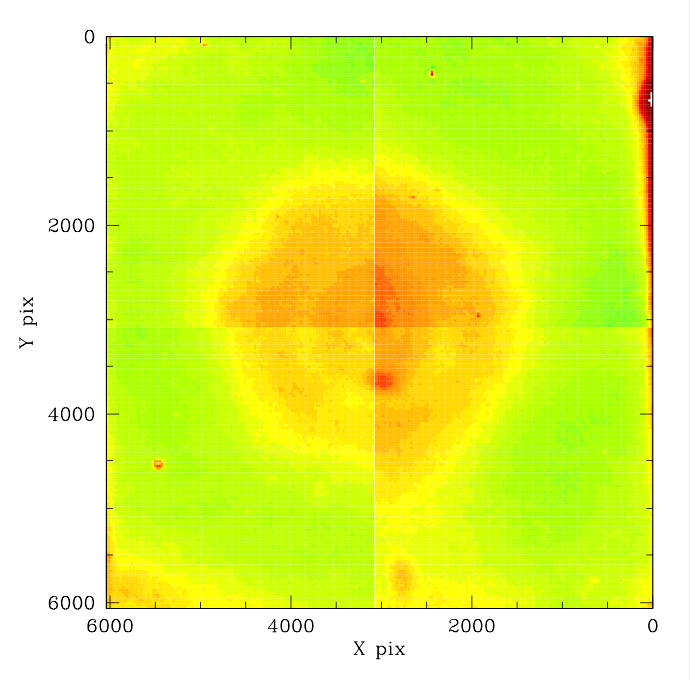
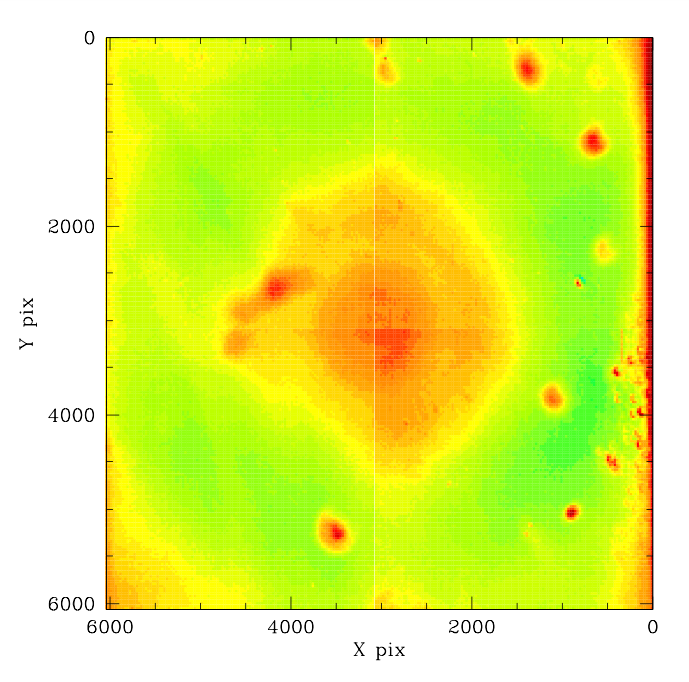

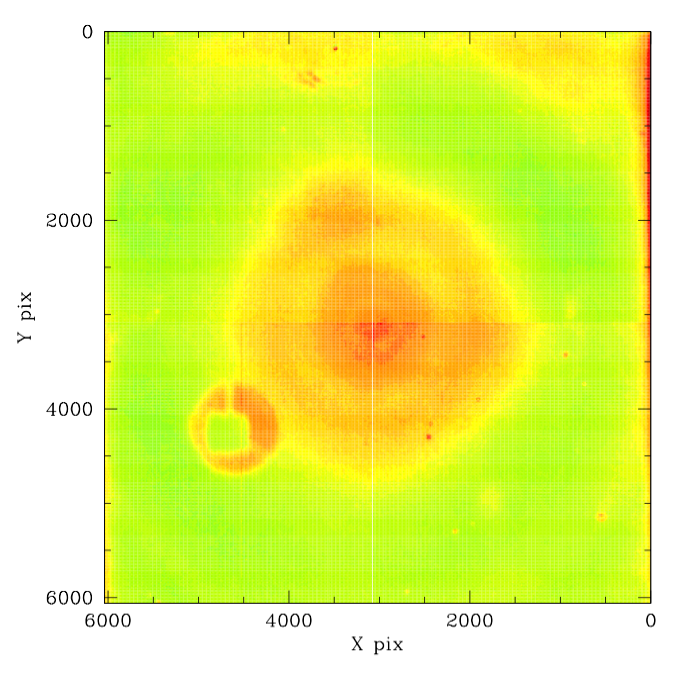
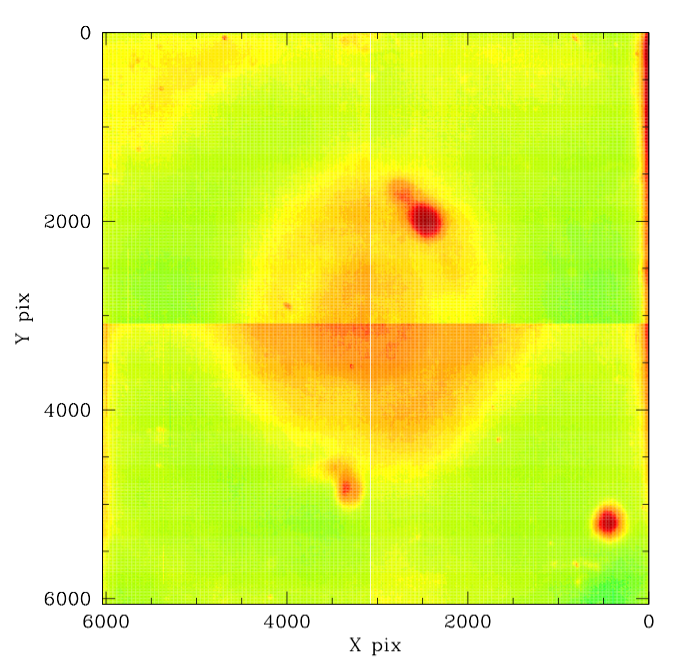
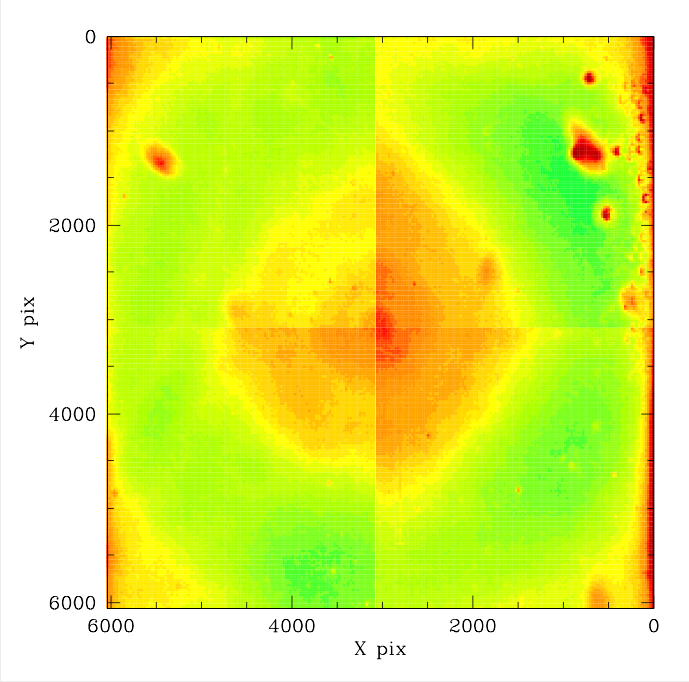
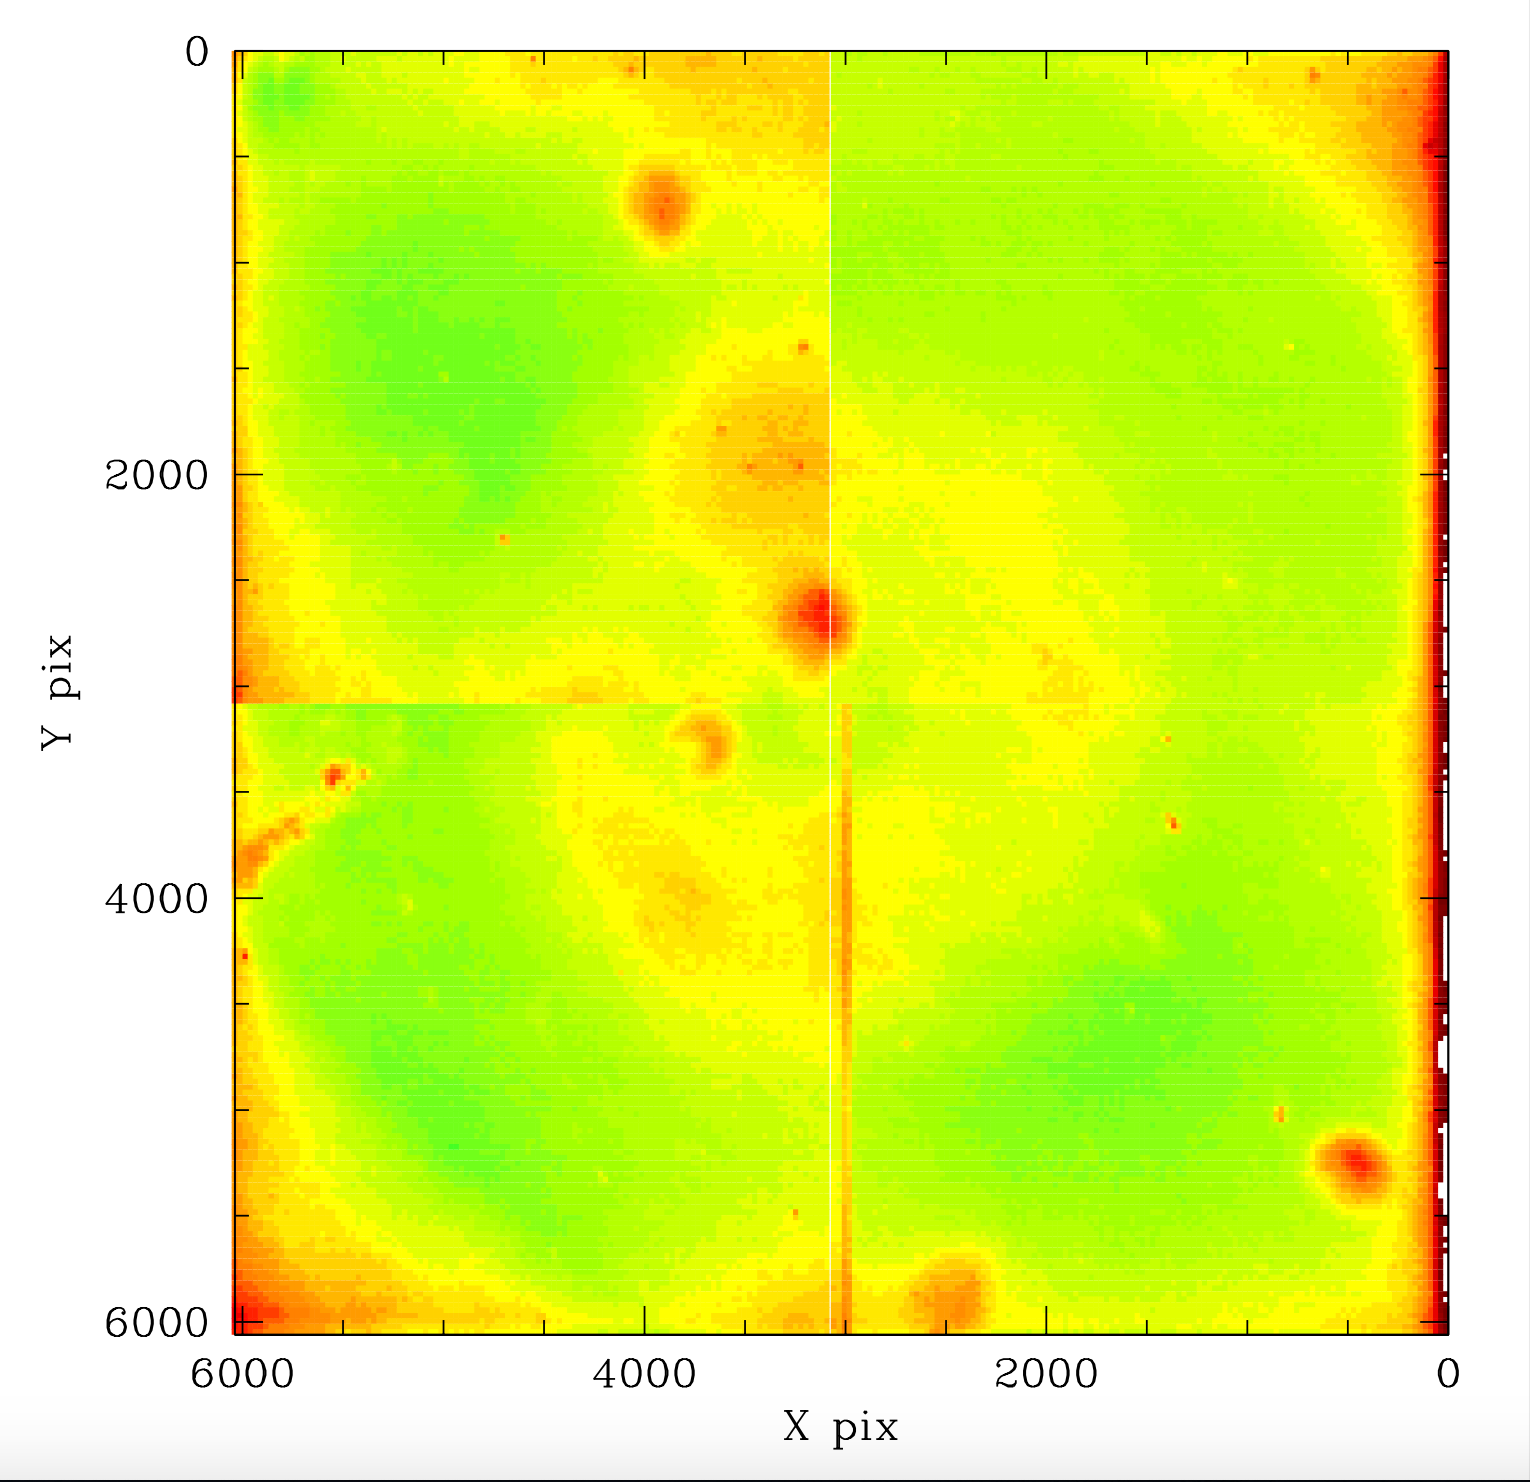
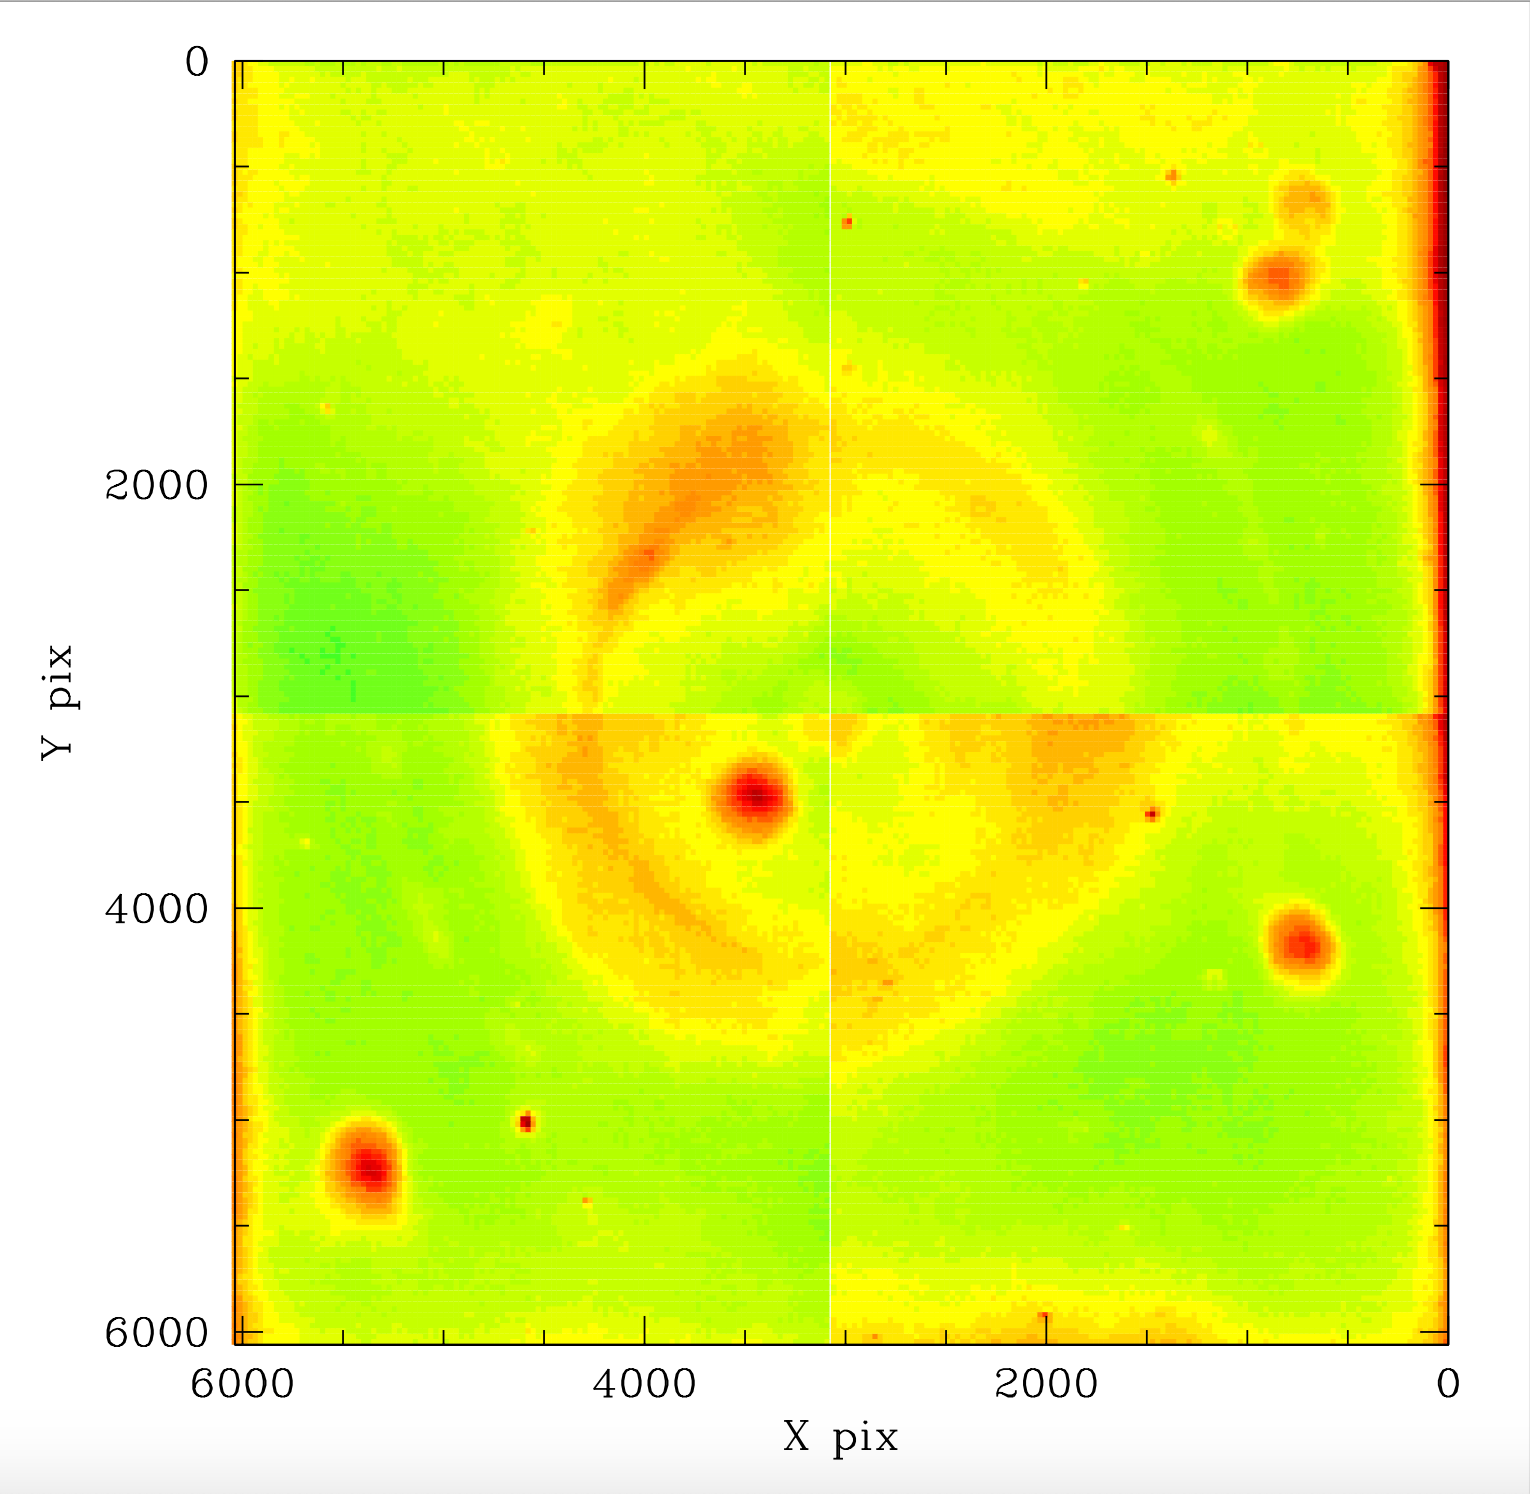
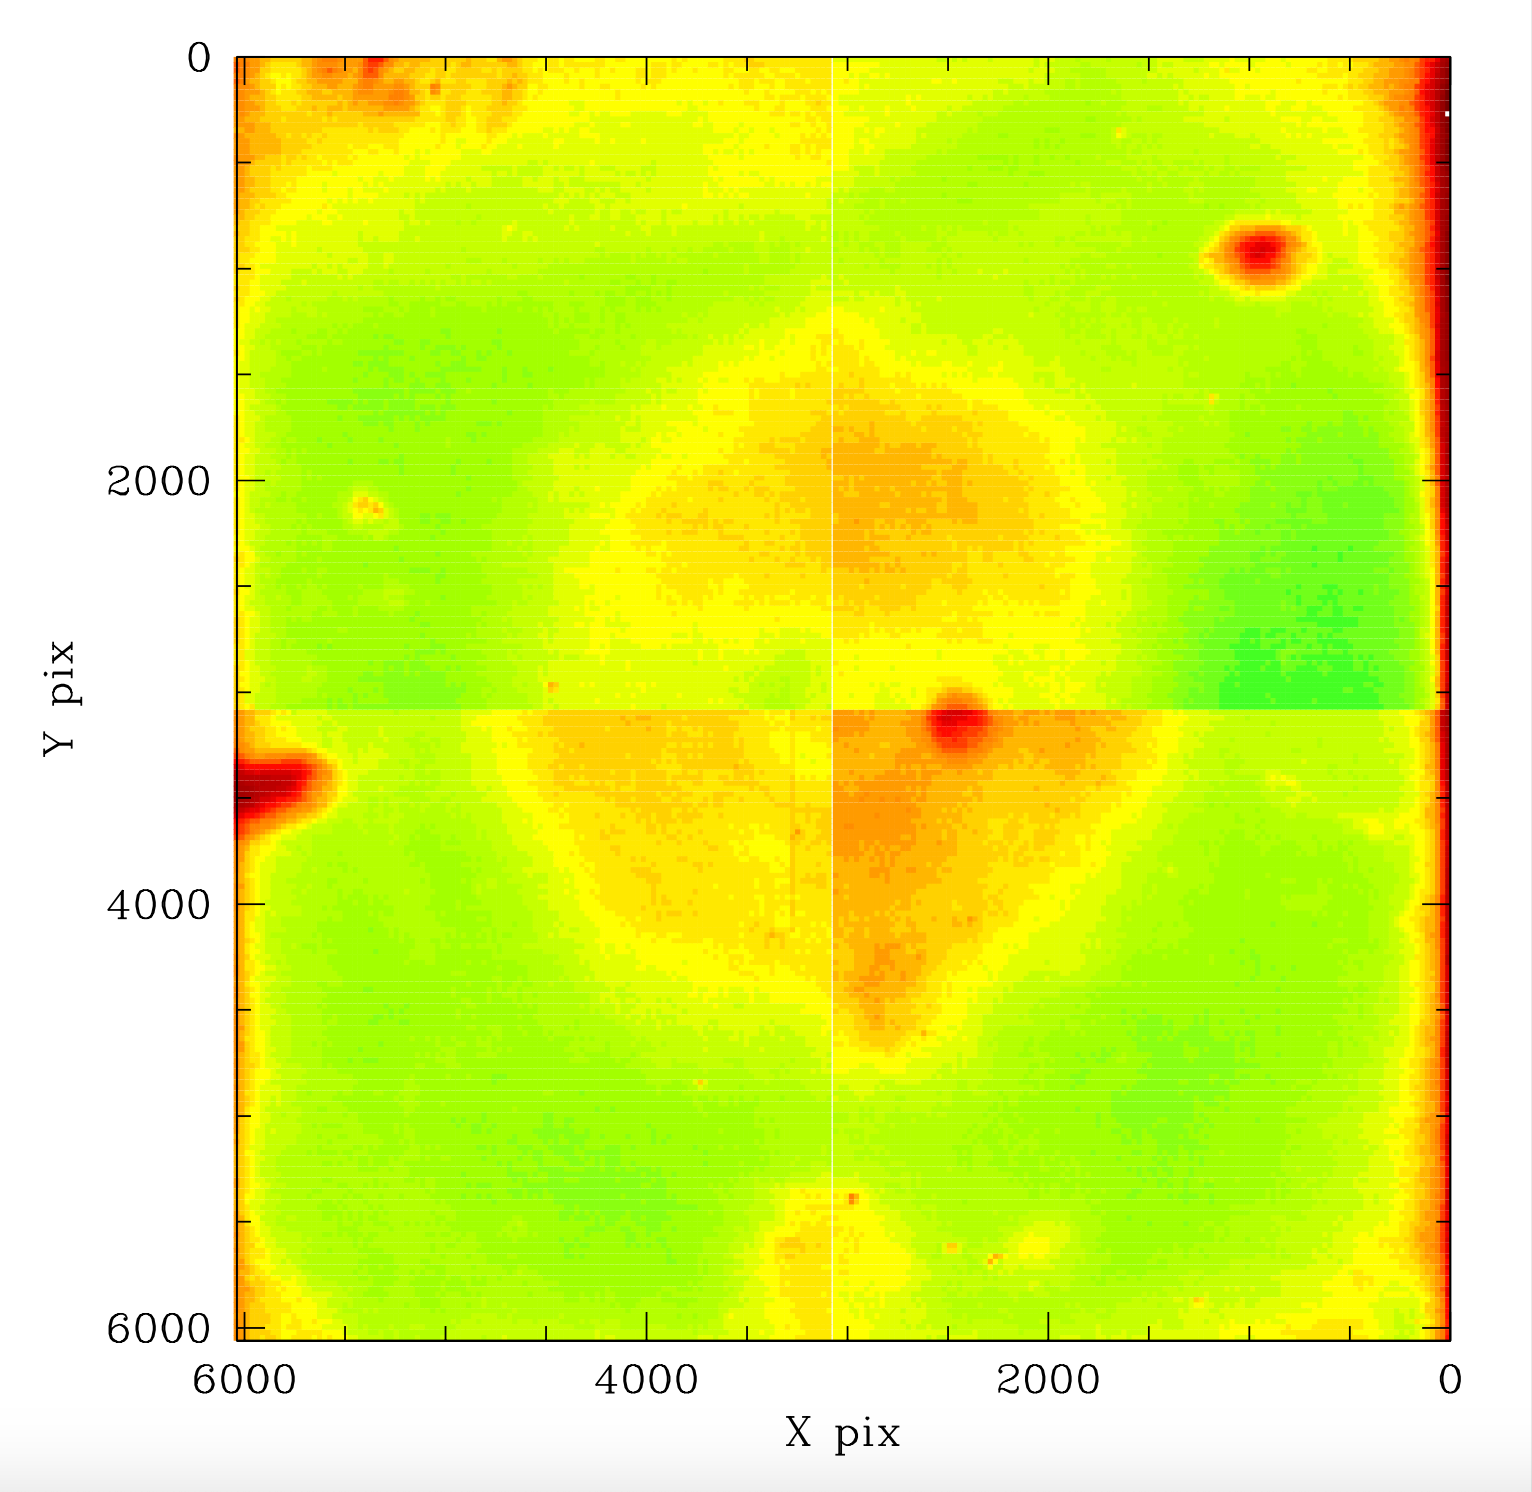
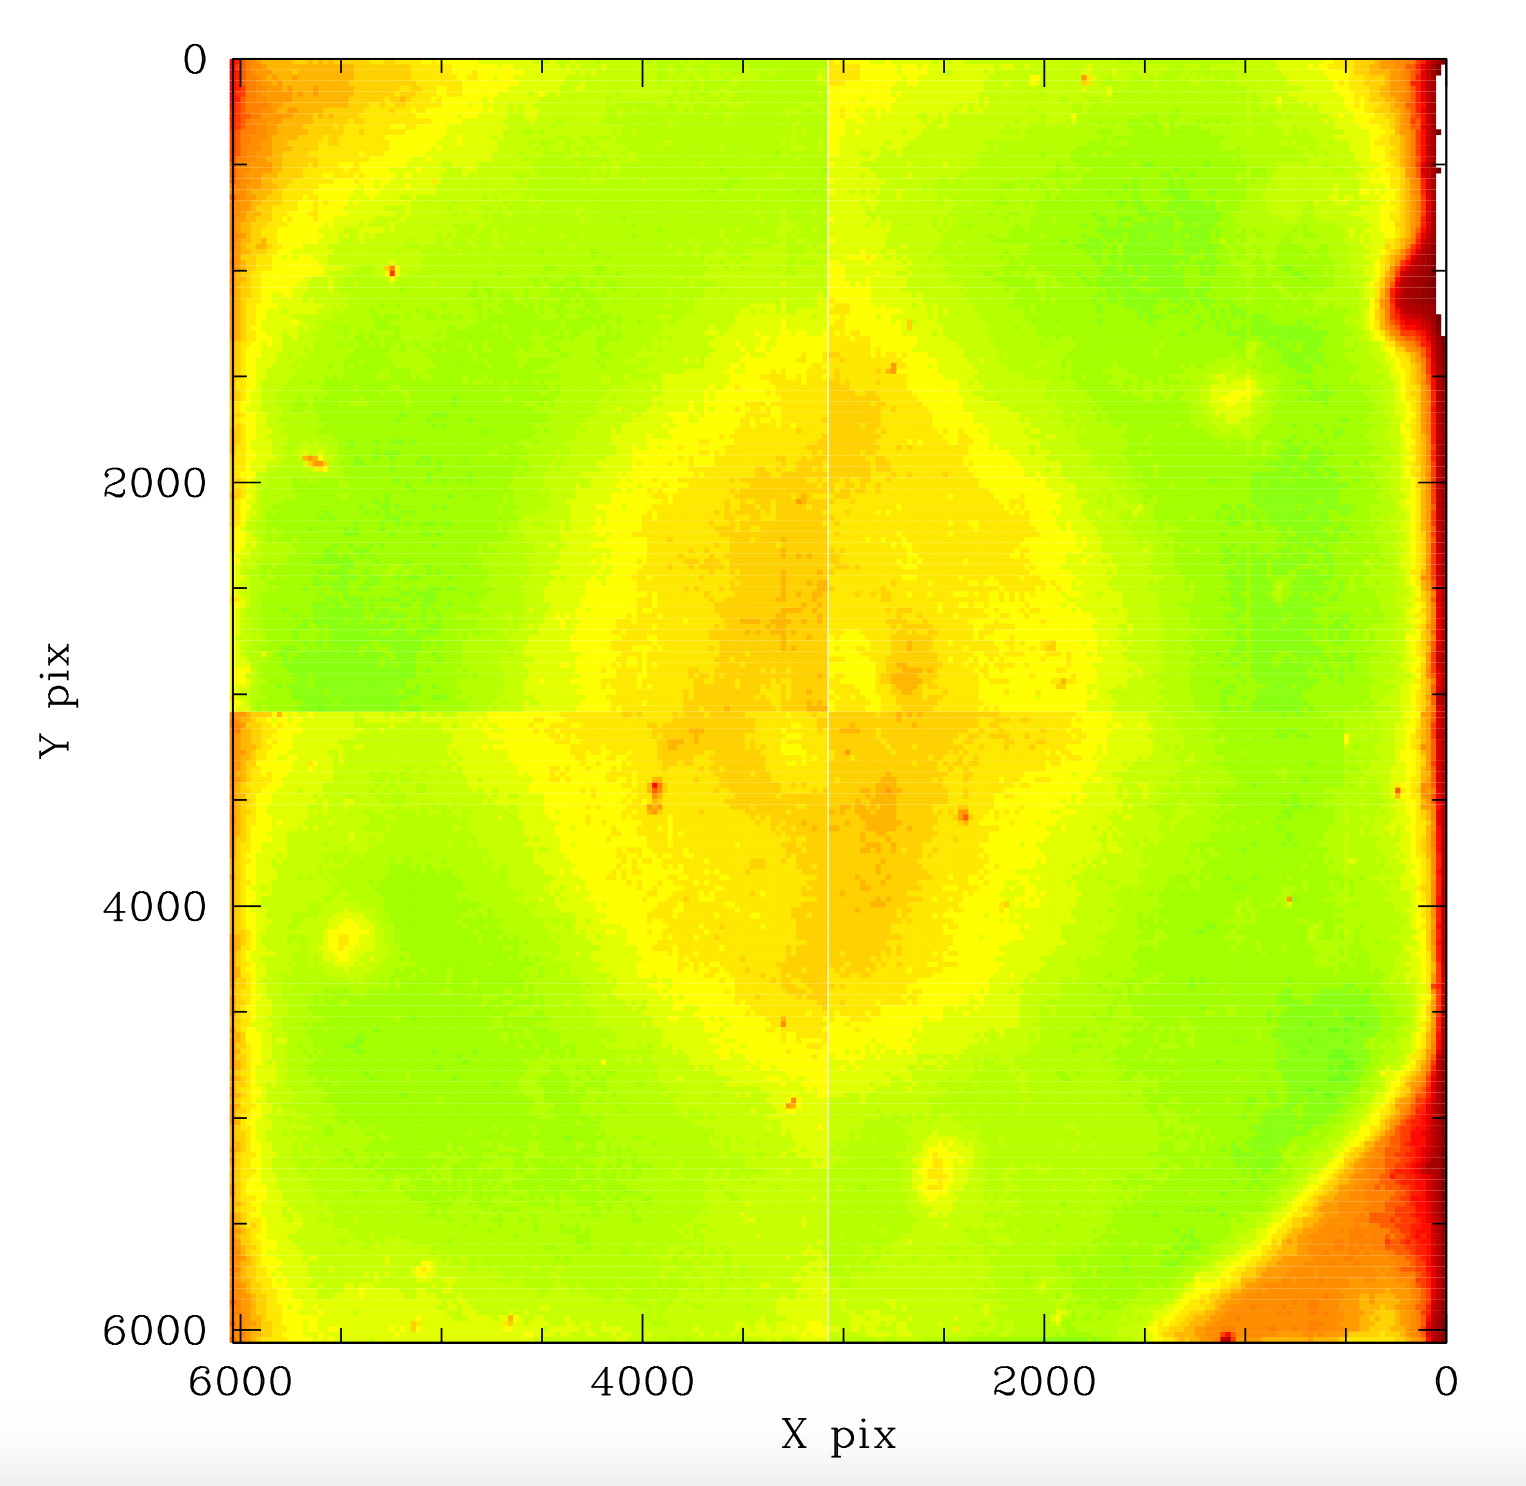
In the plots above we contrast the new photometric error maps derived from all bright calibrator measurements in ZTF-I with our initial analysis based on 30 fields. The new correction plots the appear to be accurate to ~1 mmag based on the level of spatial variation. However, there are much larger variations in the spatial residuals with time that are not correct by using these maps.
The g-band Colour Dependence of Spatial Residuals for all CCDs
Following our prior analysis of the spatial dependence on source colour, we determined the g-band residuals for all ZTF CCD.
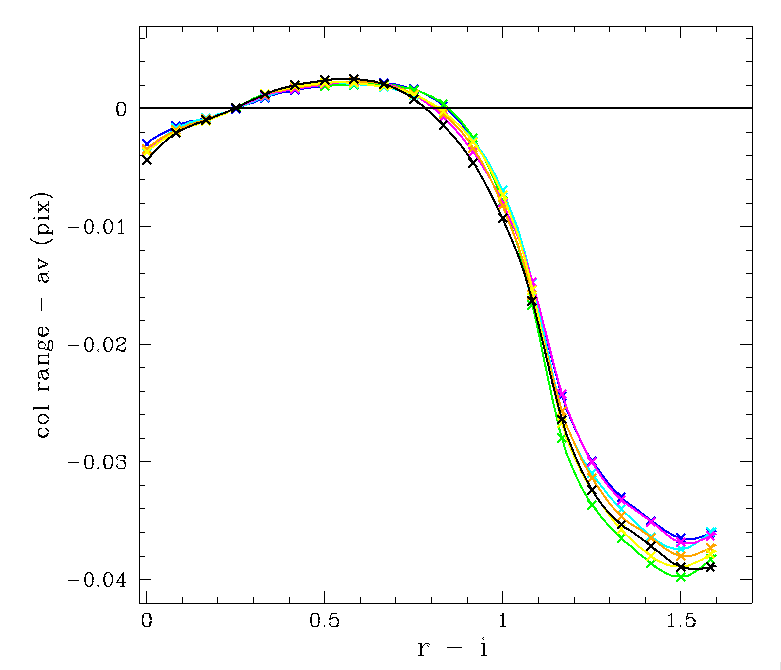
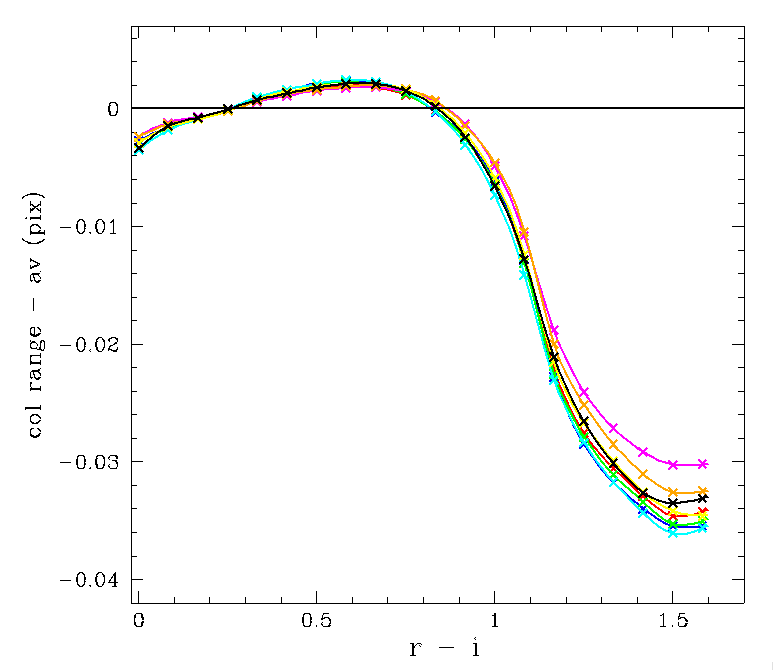
The r-i source colour dependence relative to the average g-band photometric spatial systematics shown above. Left: Response for CCDs 1 to 8. Right: response for CCDs 9 to 16.
In the plots above we show how the photometric residuals vary with source from the average based on all g-band photometry. The obvious colour dependence is due to a combination of both the CCD and filter response which both vary relative to the PS1.
Here each source colour point is the average over all pixels in a CCD. This is not strictly valid since the colour response varies where dust spots are present. Aside from this we see the colour sensitivity varies slightly from one CCD to the next. The main variations are for very red sources. The large variations in g-band response is between CCD#3 (green on left plot) and CCD#13 (magenta on right plot).
Discussion
We have completed our determination of the average photometric residuals in all CCD for ZTF g-band data. This data is use to match PS1 data and thus provide accurate magnitudes. However, since sources are generally repeatedly observed near the same position in a CCD, these corrections are not expected to greatly reduce the scatter between observations.We have completed our analysis on trends in residuals with source colour. The variation in response is very large (up to 4%) and thus must be accounted for in the calibration process. We have provided curves averaged over full CCDs for varying colour. However, it may be necessary to correct based on pixel locations due to dust spots, etc.
Based on our analysis ~1% difference in response for sources r-i ~ 1.5 there is a ~1% between CCDs 3 and 13. This appears to be consistent with our prior analysis of g-band photometry colour coefficients. A smaller effect is expected for r-band data.
Based on the slope of the colour trend, sources with colours in the range 0.8 < r-i < 1.2 are expected to have larger photometric errors. However, ~97% of ZTF calibrator sources have r-i < 0.75. The source colour dependence is much smaller in g-r. However, due to the source colour degeneracy in g-r, PS1 i-band data is required for sources with g-r > 1.0.