| Topics |
|---|
| Spatial structure variations over time |
| Discussion. |
Variation in Spatial Structures Over Time
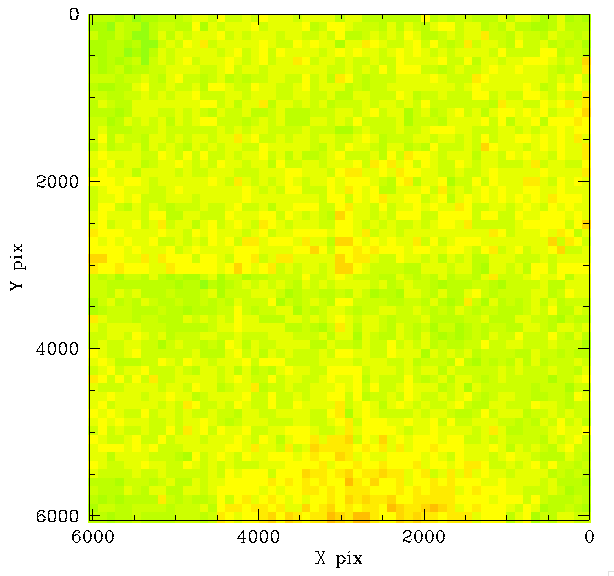
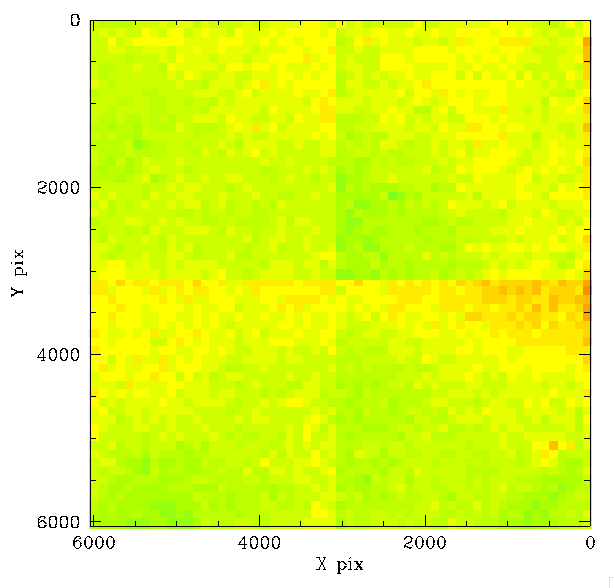
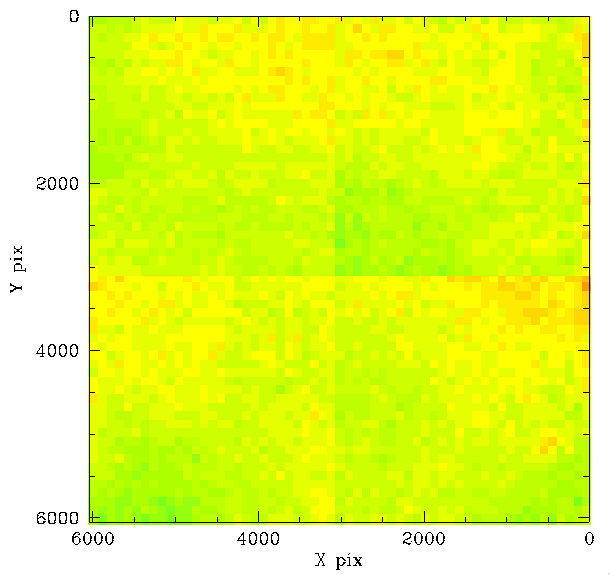
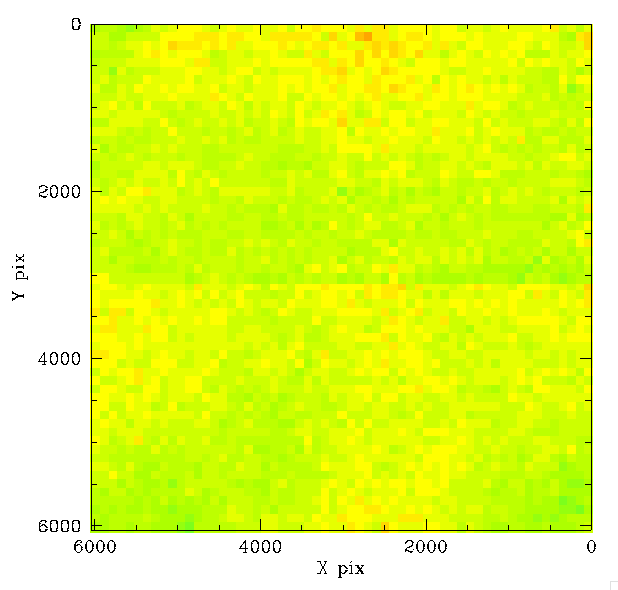
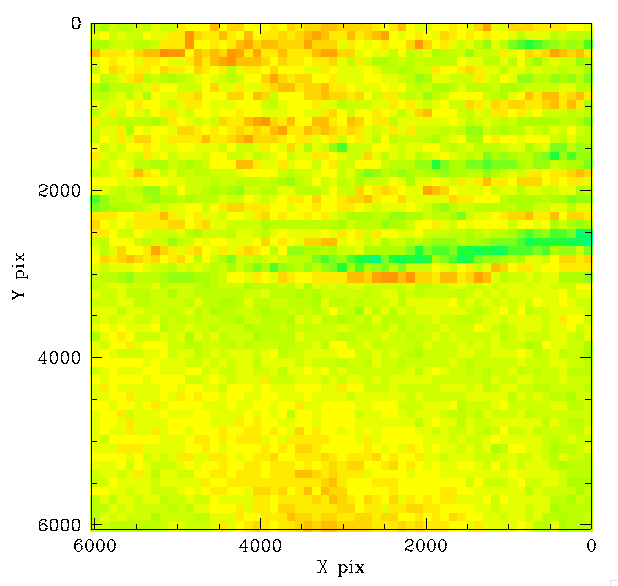
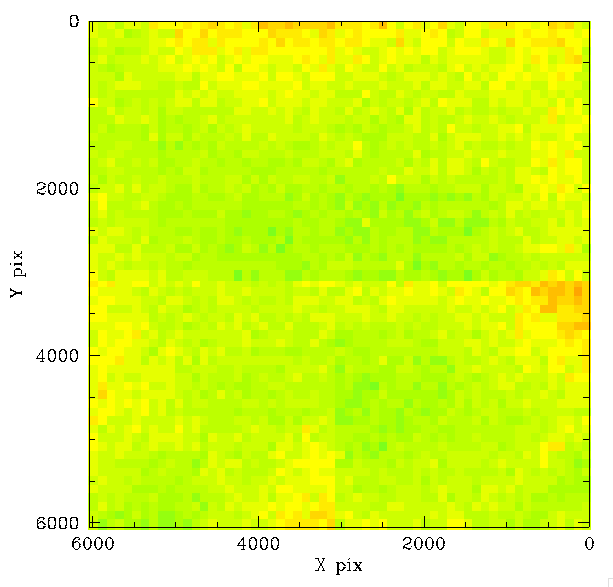
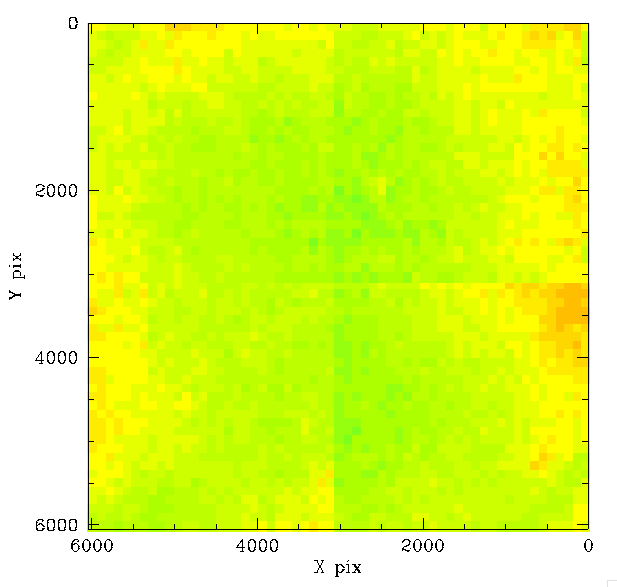
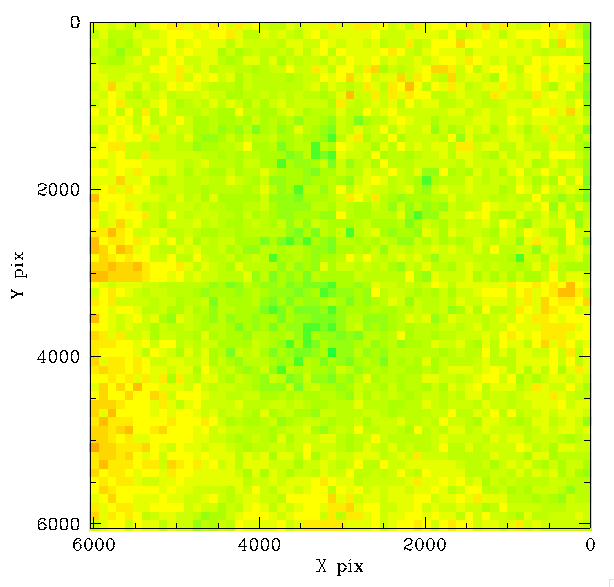
Besides the presence of a varying gain with sky level it is worth considering how the spatial structure of the resiudals might have changed during ZTF-I. In our previous work we looked for signs of variations on indvidual nights and found little evidence. However, while it is clear the general structure does not change that work was limited by the number of sources present on an individual night. To look for smaller changes over longer times we decided to combine the residuals from multiple nights to increase the S/N. We divided the 725 nights of data into 29 separate sets of 25 nights. Since the underlying residual structure is significant we subtract the average over all nights from each and plot the residual to observe the variations.
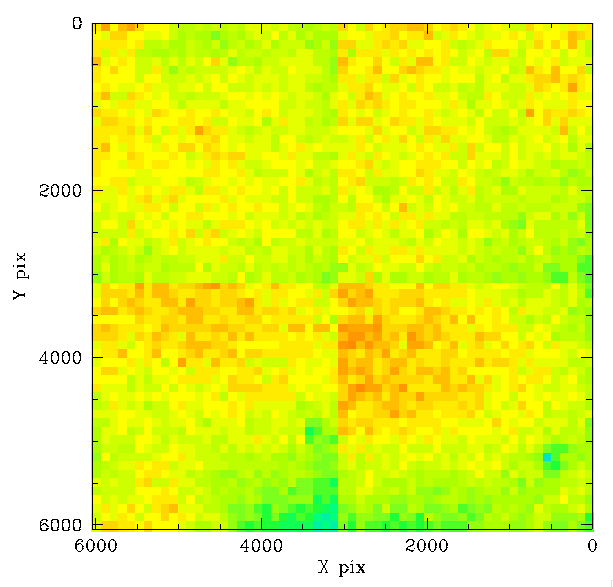
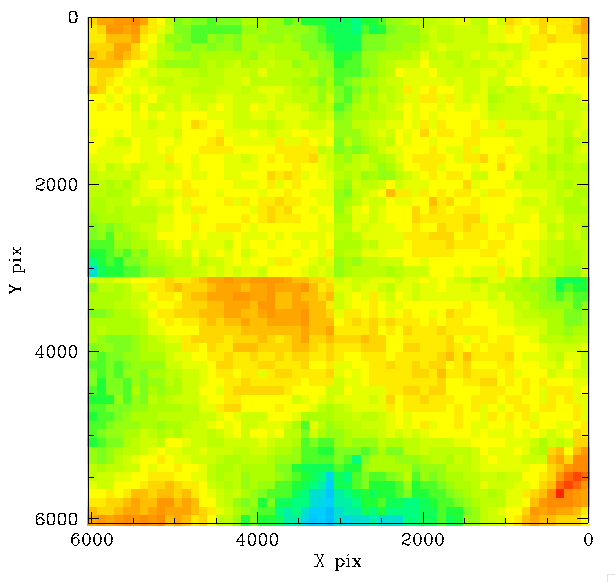
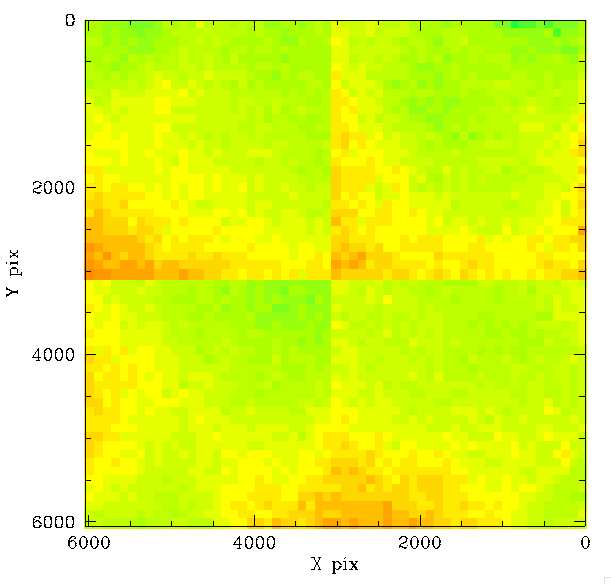
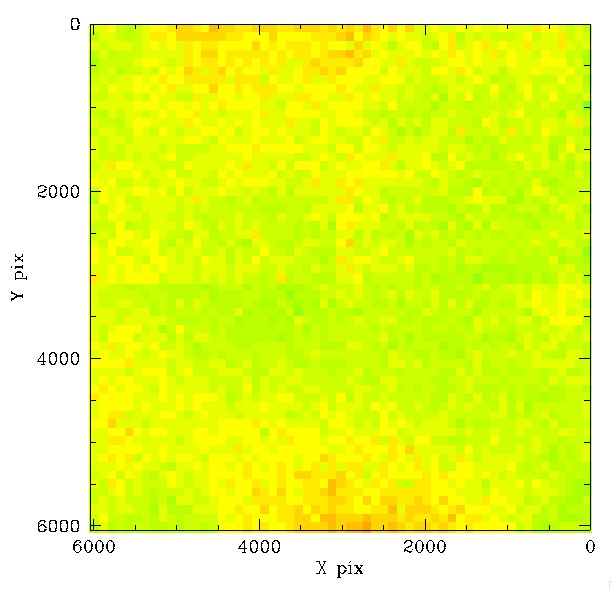
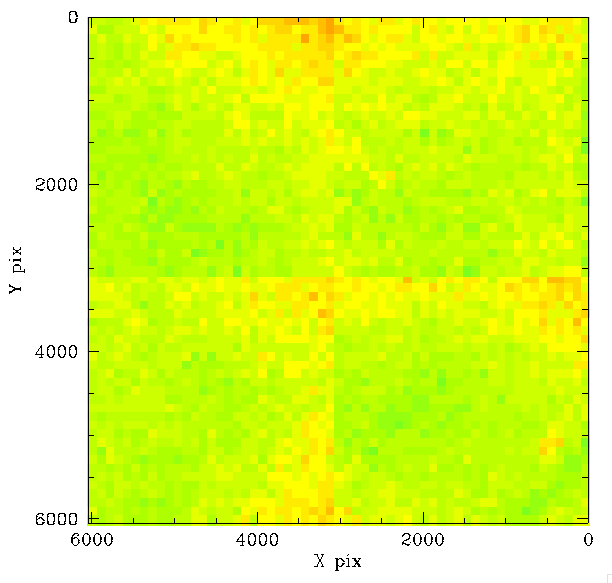
Temporal variation relative to average for dates 2018-07-11, 2018-08-06, 2018-09-06. Plots as noted above.
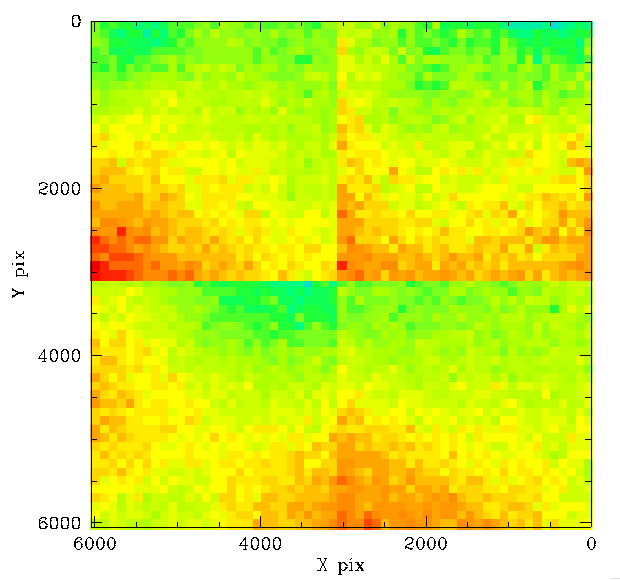

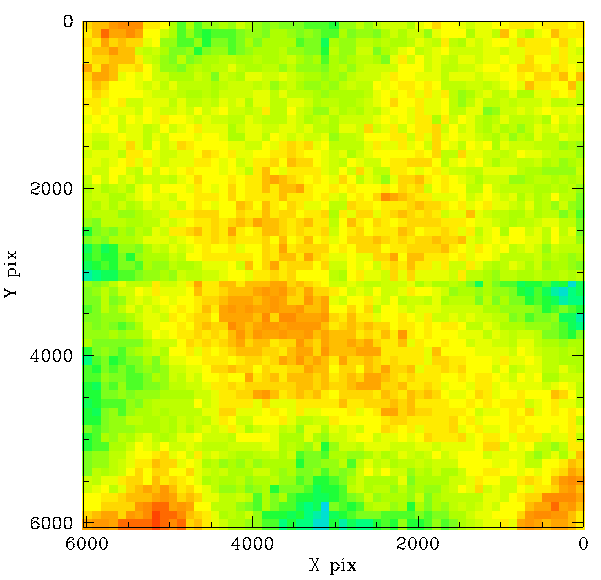
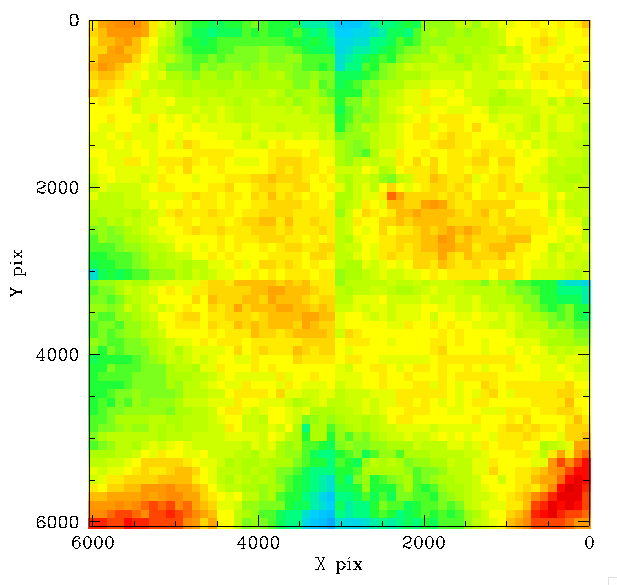
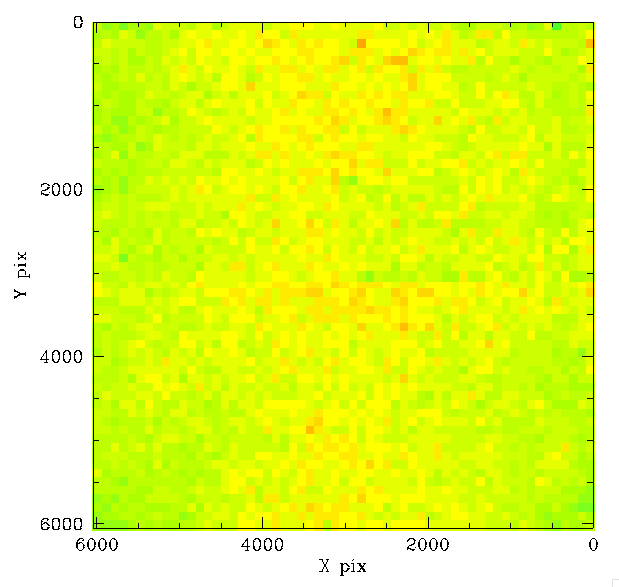
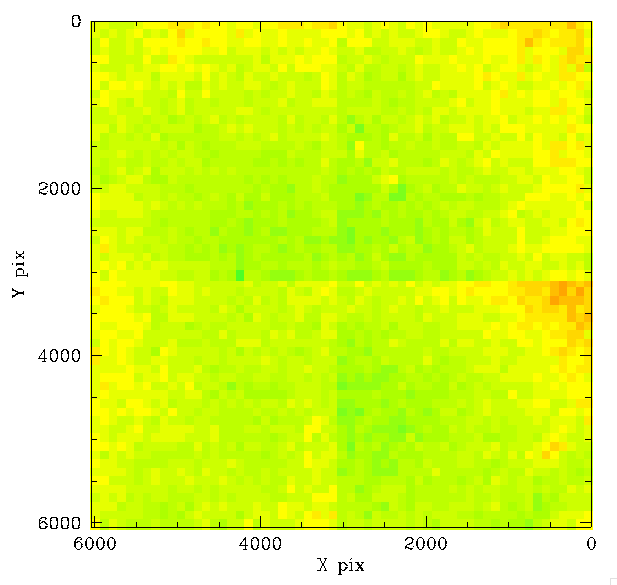
Temporal variation relative to average for dates 2018-10-16, 2018-12-02, 2019-01-11. Plots as noted above.
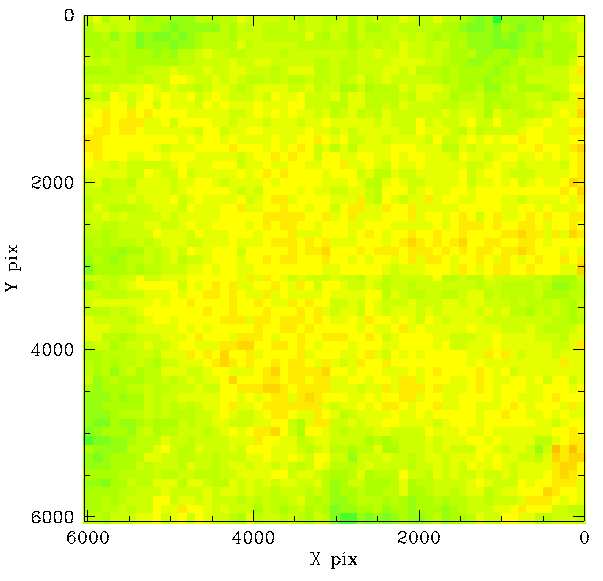
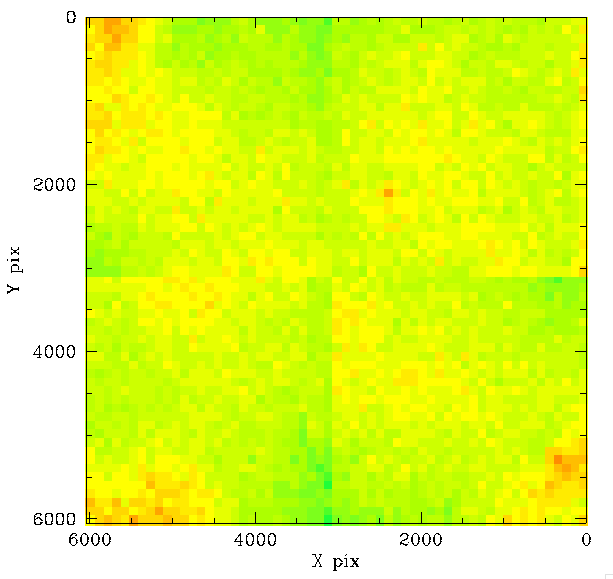
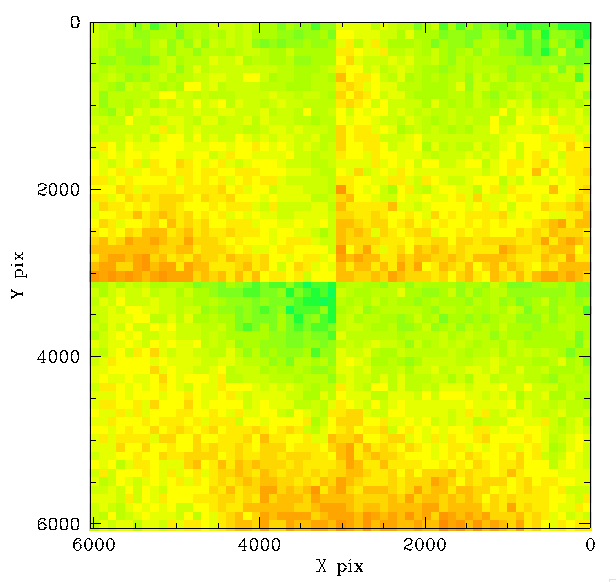
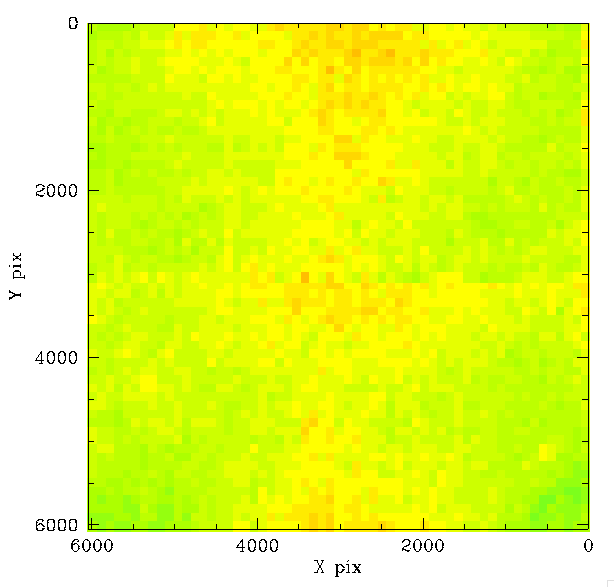
Temporal variation relative to average for dates 2019-03-04, 2019-04-17, 2019-05-25. Plots as noted above
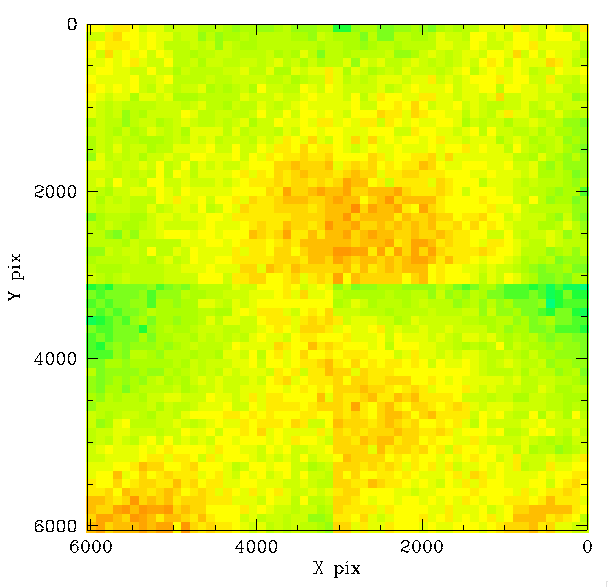
Temporal variation relative to average for dates 2019-06-25, 2019-07-22, 2019-08-18. Plots as noted above.
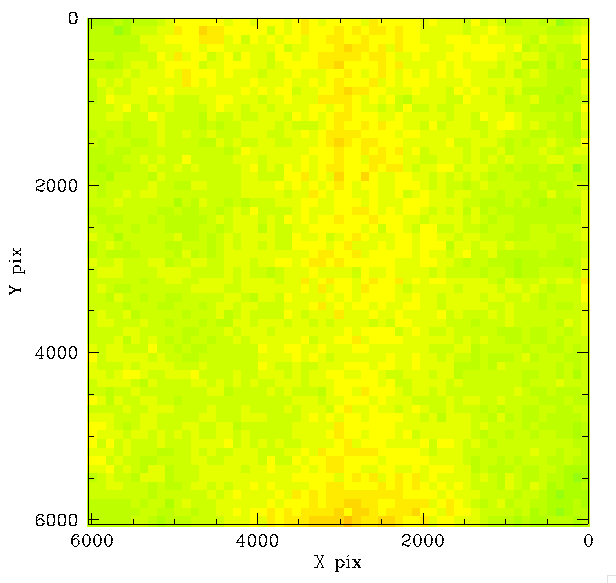
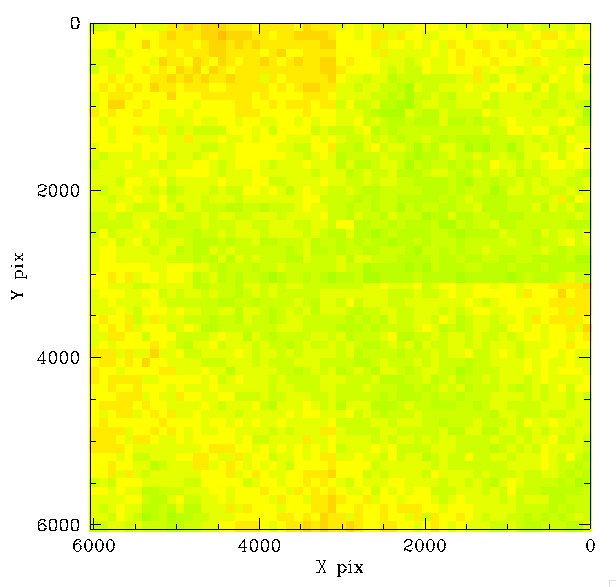
Temporal variation relative to average for dates 2019-09-12, 2019-10-09, 2019-11-04. Plots as noted above.
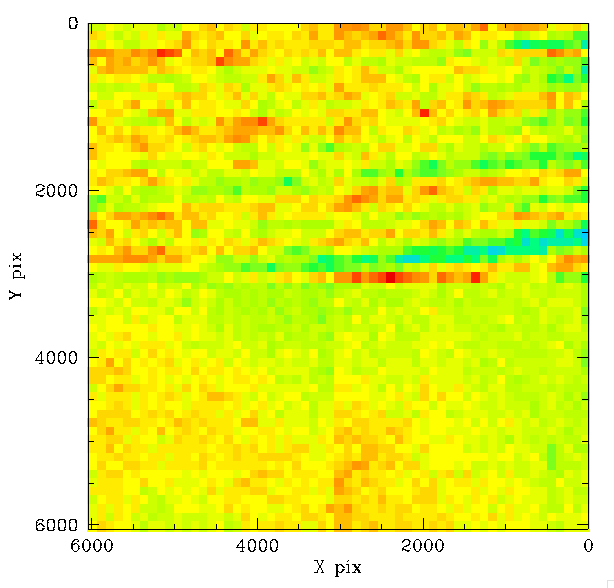
Temporal variation relative to average for dates 2019-12-11, 2020-01-18, 2020-02-17. Plots as noted above.
Temporal variation relative to average for dates of 2020-04-09, 2020-05-16, 2020-06-15. Plots as noted above.
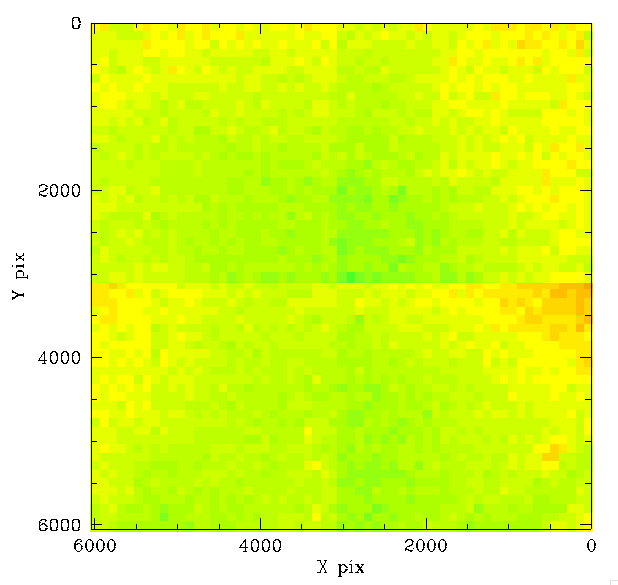
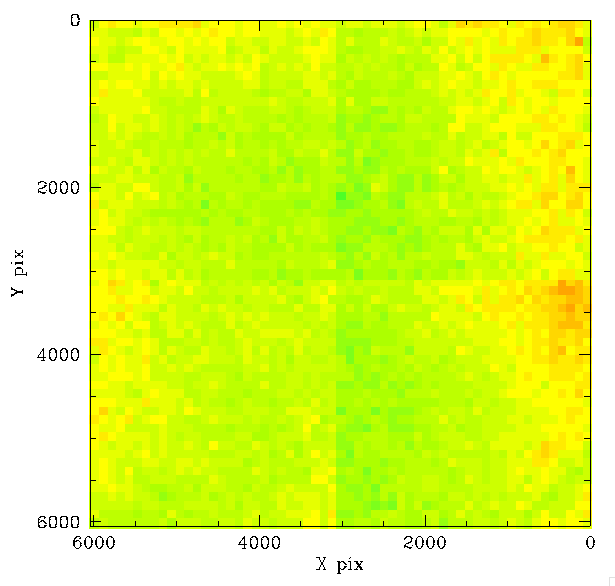
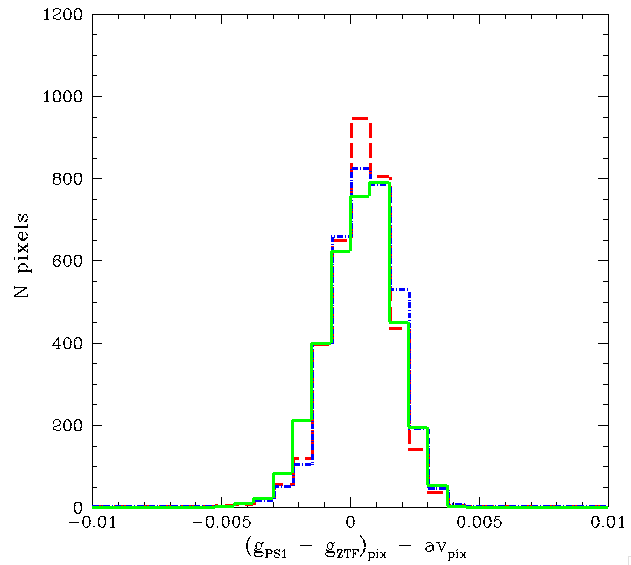
Temporal variation relative to average for JDs of 2020-07-11, 2020-08-05, 2020-08-31. Plots as noted above.
Temporal variation relative to average for JDs of 2020-09-28, 2020-10-23. Plots as noted above.
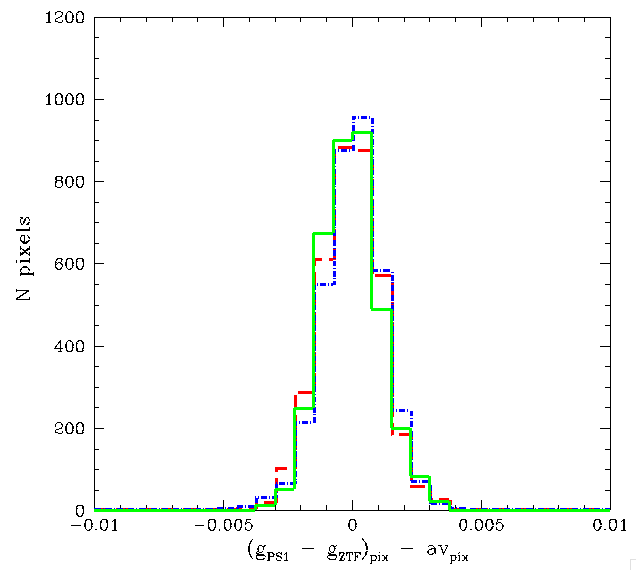
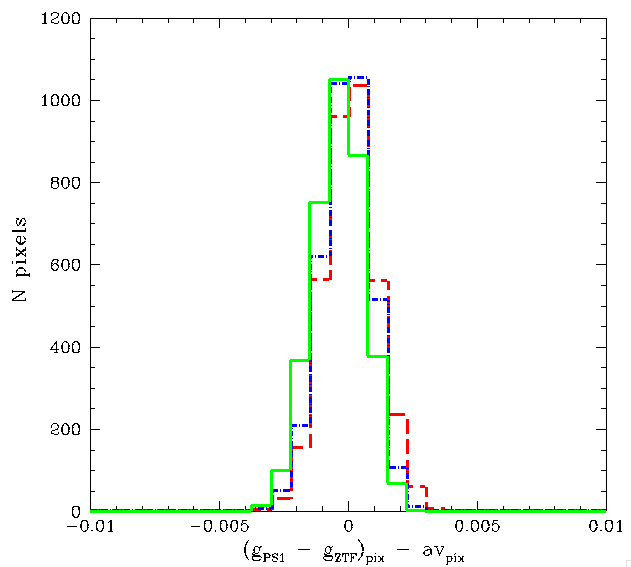
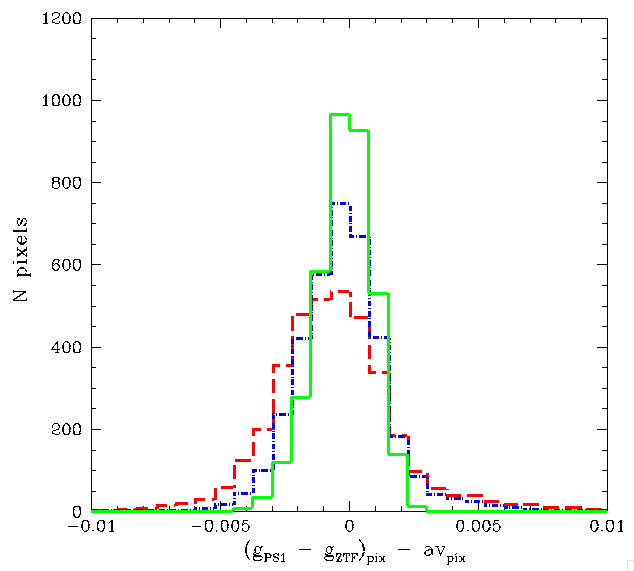
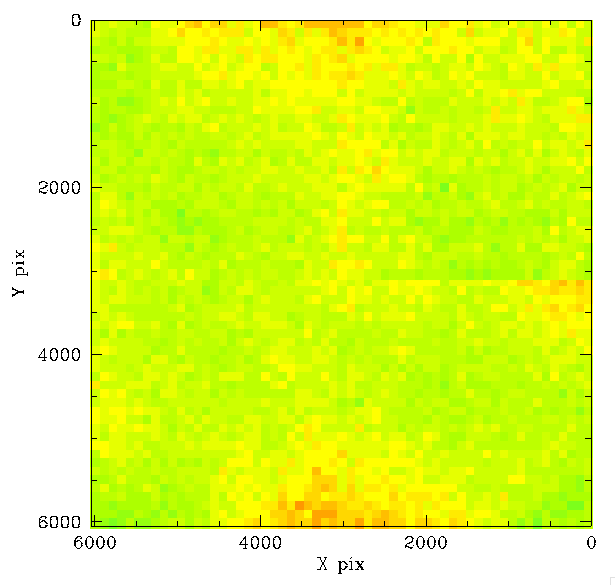
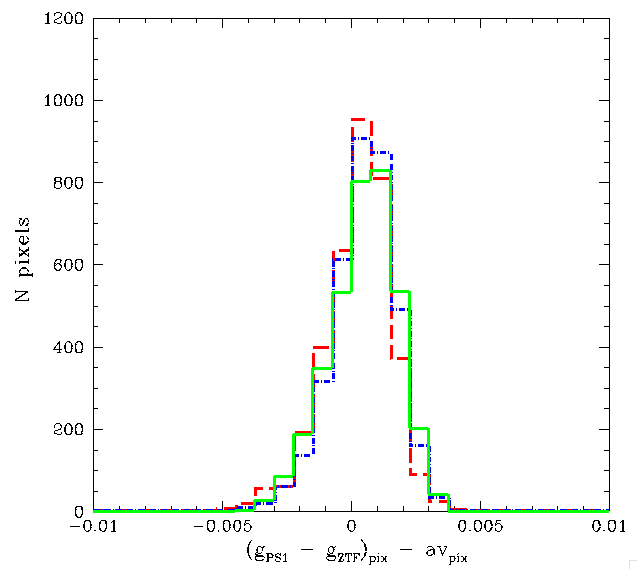
In the above plots we show the difference in g-band spatial structure relative to the average for sets of 25 nights spanning the observation range of ZTF-I. Overall the variations in photometric residual structure over time is generally < 5 millimags. However, we some obvious spatial structure that varies over time. For example, we see that there is similar residual structure between 2018-05-17 and 2018-09-06. This is then followed by different structure between 2018-10-16 and 2019-01-11, which roughly corresponds with the period of changes between "C" and "E" in the flats. On 2019-03-04 the previous structure seen earlier returns. There is also strong structure in quadrants and 1 and 2 on the 2019-12-11 and 2020-01-18 data due to the known "bad flat" fields taken over that time. The actual indivual nights are likely to have much stronger structure that is reduced here by the combination with good nights. Finally, there is also some weak structure seen between 2020-05-06 and 2020-09-28.
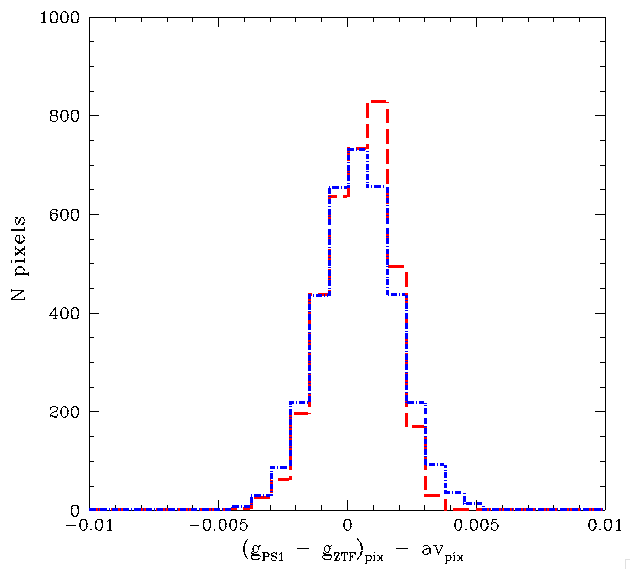
The pixel values in these combined images above appear accurate to ~2 millimag based on the level of structure that is seen in them.
In the above plot each pixel is generally the average of a few thousands measurements with mag g_inst < -7 (g ~ 19).
Discussion
We have used Zubercal to calibrate the ZTF photometry for 725 nights of data to PS1. We then determine the spatial residuals on timescales of ~ 1 month (25 nights with data). Comparing each set of data high S/N we see very slight changes in the amplitude and distribution of the spatial residuals compared to the average of all nights. Generally the level of variation is < 5 millimags. However, some of the early nights as well as the nights with bad flats have larger variations.
More work is require to determine the scale limit of the spatial structure.