| Topics |
|---|
| Spatial structure variations in CCD-6 r-band. |
| Spatial structure variations in CCD-7 over time. |
| Spatial structure a varying scales. |
| Discussion. |
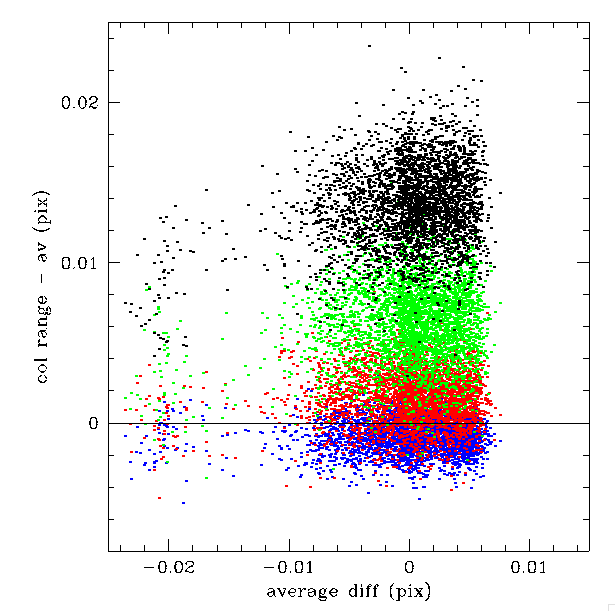
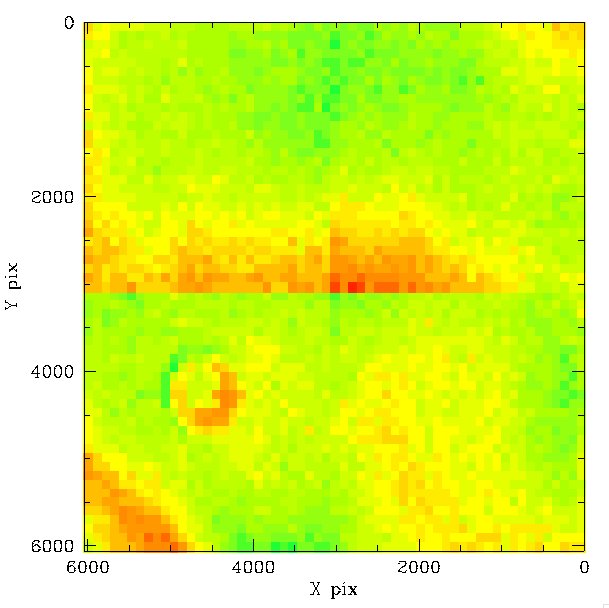
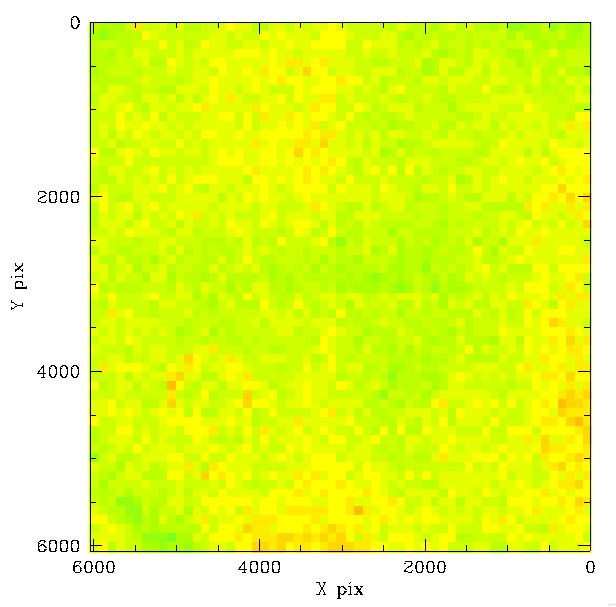
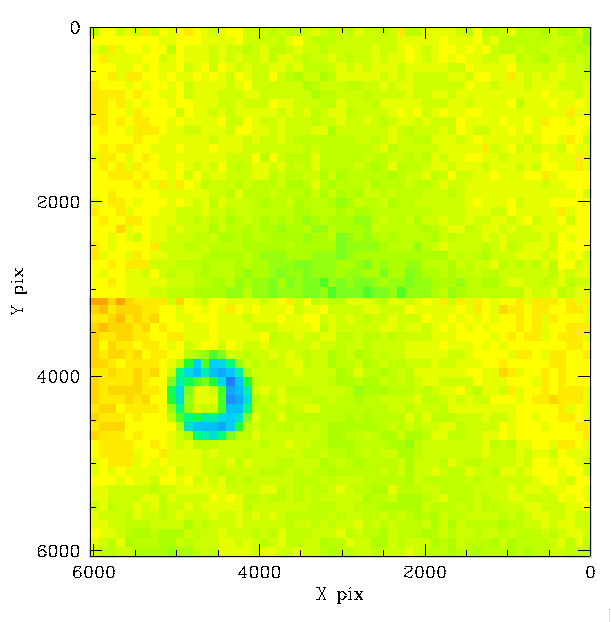
Average spatial residuals in CCD-6 for ZTF r-band
To compare how the residuals in r-band vary from those of g-band we Zubercaled 725 nights of r-band CCD-6 observations. We then averaged and binned the residuals.
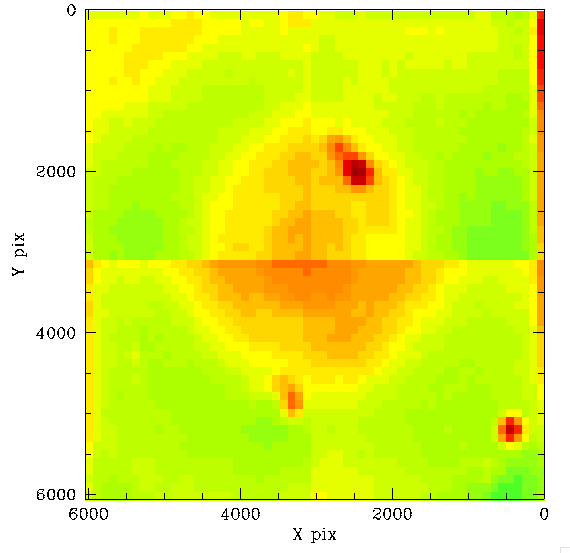
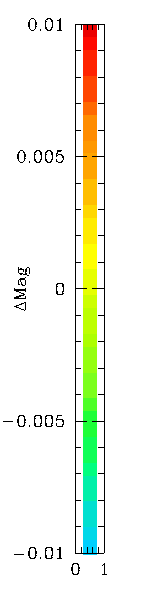
Averaged spatial residuals in g-band and r-band for ZTF compared PS1 for CCD-6. Left: g-band residuals, right: r-band residuals.
The above result shows the very similar residual structure to g-band, but with significantly lower amplitude. This is completely consistent with the prior analysis.
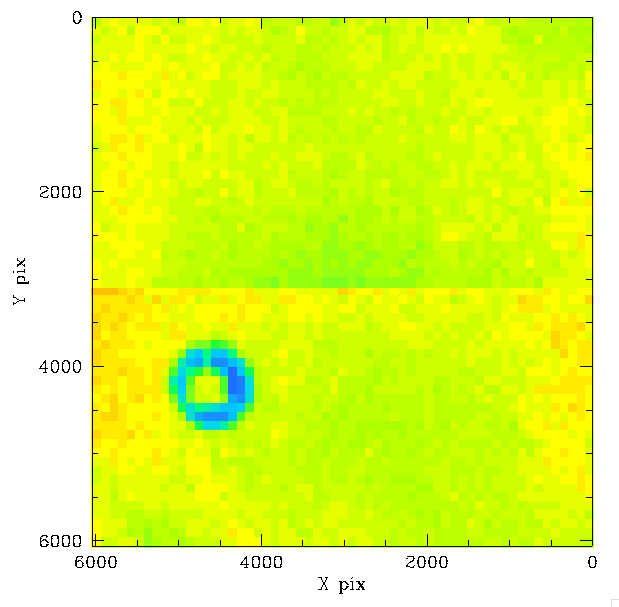
Spatial residual variations in ZTF CCD-6 r-band with PS1 r - i source colour
Here we repeat the prior analysis of CCD-6, but with r-band data. We once again divide the sources by their r-i colours since these values do not suffer the same degenerate problems as g-r colours.
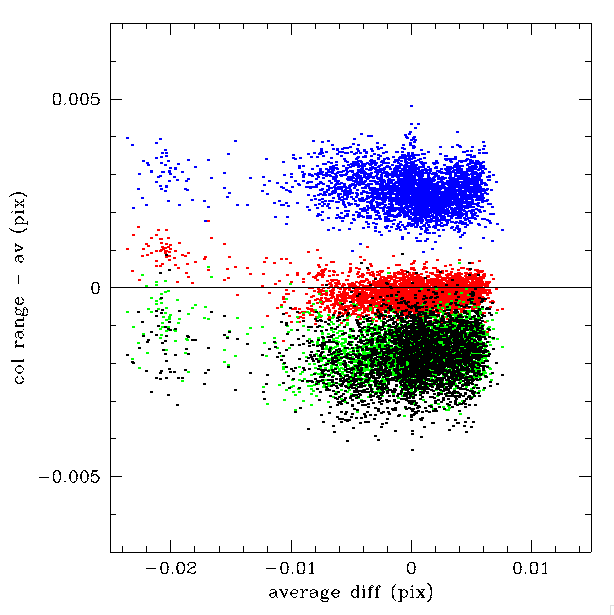
In the plot above we see that like the g-band the variation with r-band colour is mainly an offset wrt to the average structure. Clear the offsets are smaller than in g-band. This is expected since the residual structure has a lower amplitude in r-band in general.
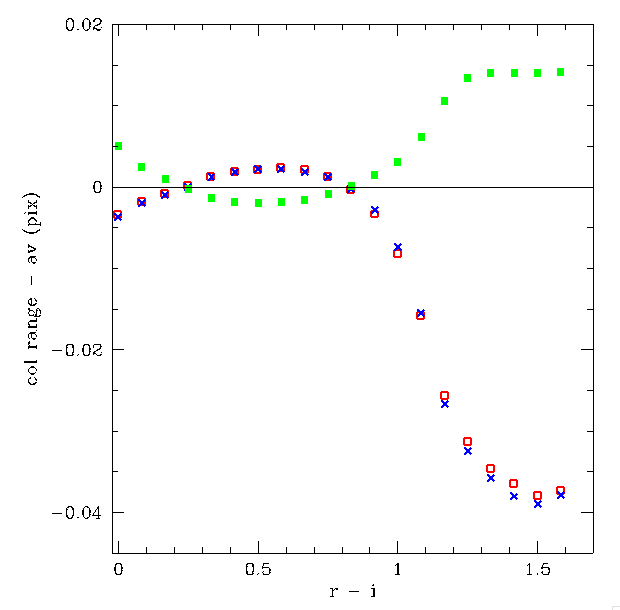
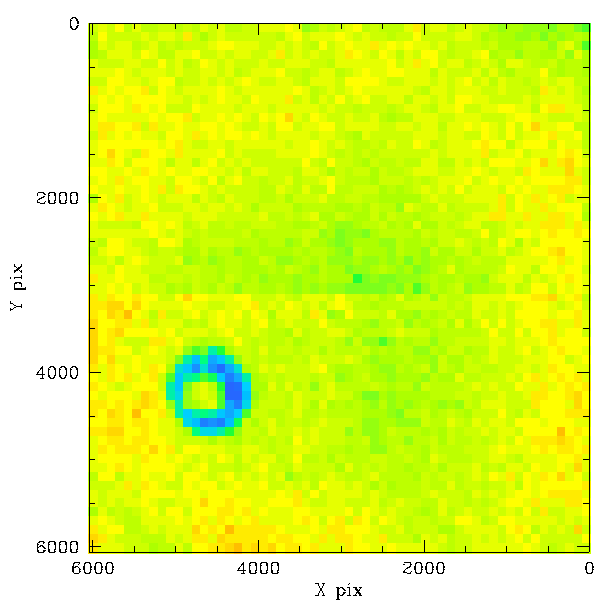
In the plot above we see that both CCD-6 and CCD-7 have very similar colour dependence in g-band while the dependence in r-band is very different (as expected). The dependence with increasing r-i colour in r-band is opposite to g-band.
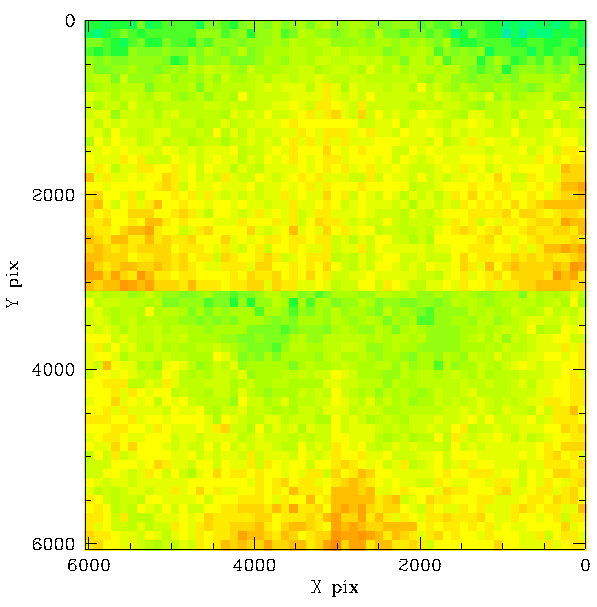
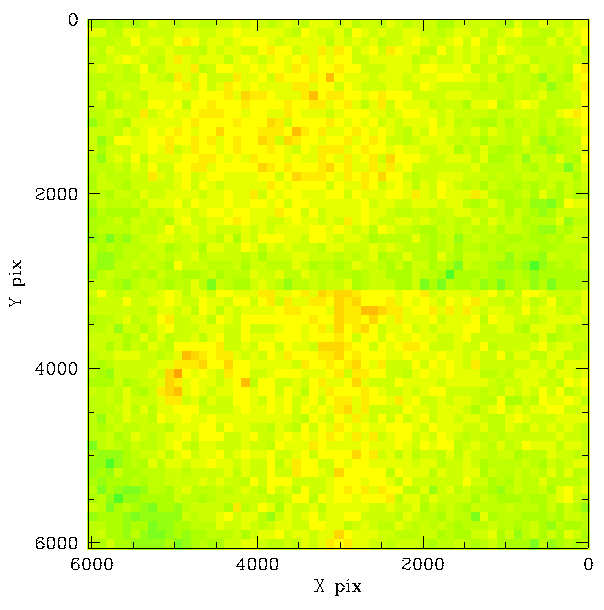
Variation in Spatial Structures Over Time for CCD-7 (g-band)
Variations in g-band calibration residuals for ZTF compared PS1 for CCD-6 wrt the average offset in a pixel with varying r-i source colour.
In our previous work of CCD-6 g-band we found significant variations over periods of months. To confirm whether such variations also occur in well-behaved CCD-7 we repeated our analysis.
As before, we divided the 725 nights of data into 29 separate sets of 25 nights. Since the underlying residual structure is significant we subtract the average over all nights from each and plot the residual to observe the variations.
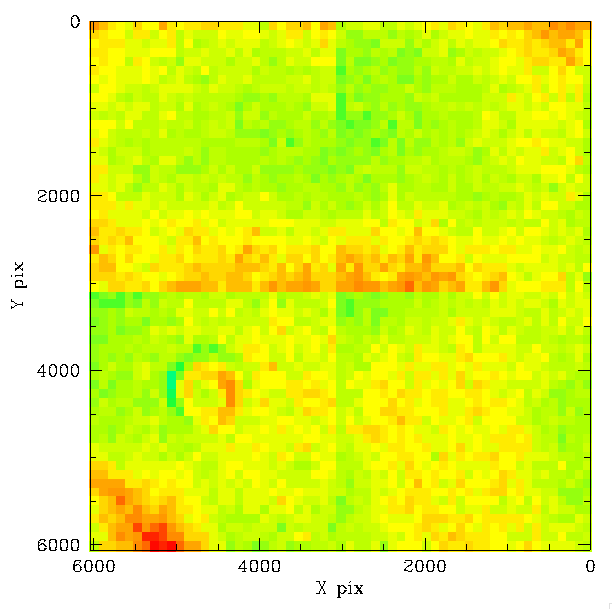
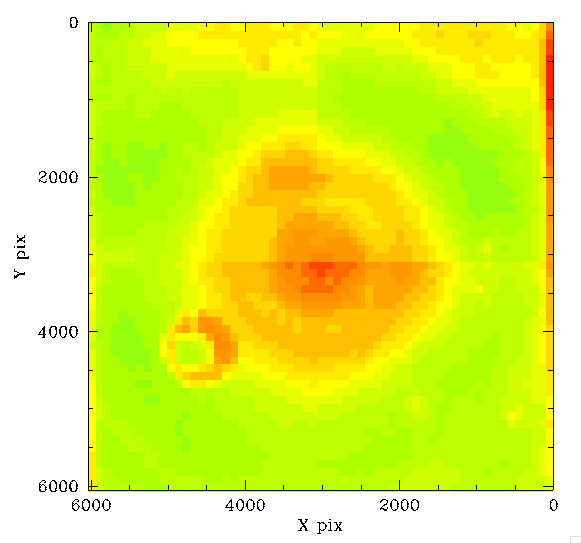
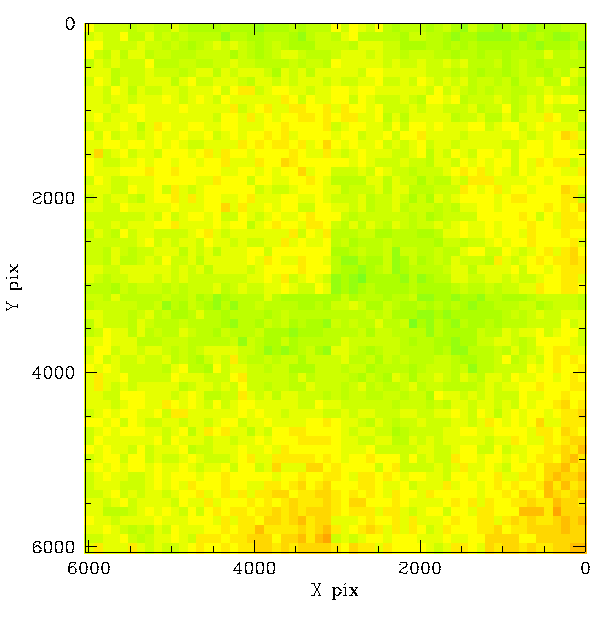
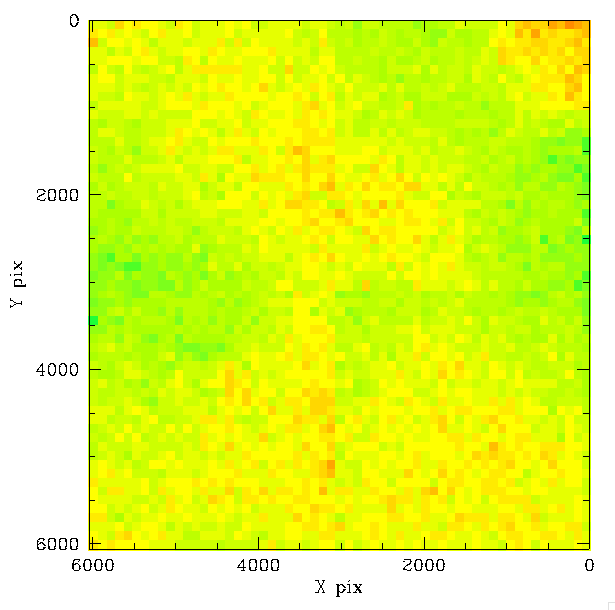
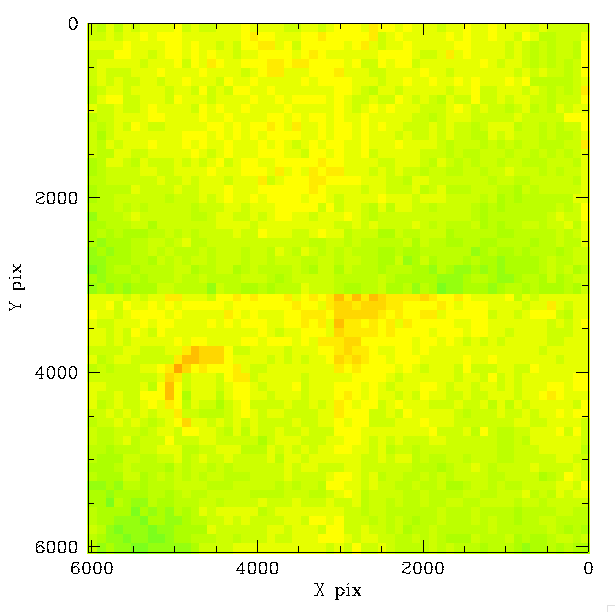
Temporal variation relative to average for dates 2018-07-11, 2018-08-06, 2018-09-06. Plots as noted above.

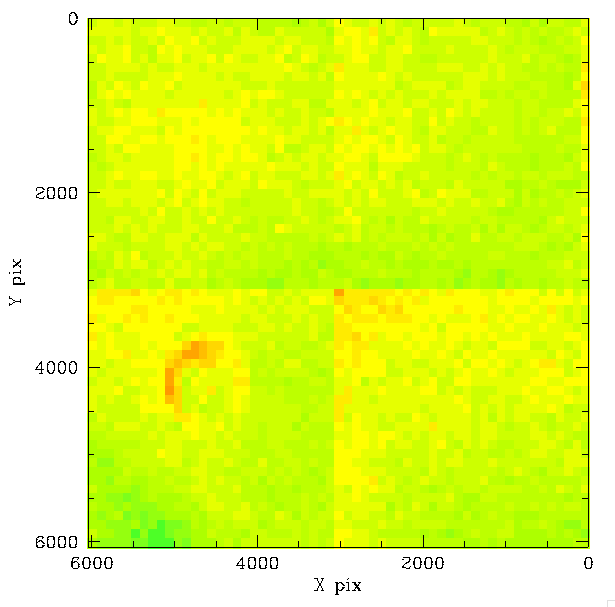
Temporal variation relative to average for dates 2018-10-16, 2018-12-02, 2019-01-11. Plots as noted above.
Temporal variation relative to average for dates 2019-03-04, 2019-04-17, 2019-05-25. Plots as noted above
Temporal variation relative to average for dates 2019-06-25, 2019-07-22, 2019-08-18. Plots as noted above.
Temporal variation relative to average for dates 2019-09-12, 2019-10-09, 2019-11-04. Plots as noted above.
Temporal variation relative to average for dates 2019-12-11, 2020-01-18, 2020-02-17. Plots as noted above.
Temporal variation relative to average for dates of 2020-04-09, 2020-05-16, 2020-06-15. Plots as noted above.
Temporal variation relative to average for JDs of 2020-07-11, 2020-08-05, 2020-08-31. Plots as noted above.
Temporal variation relative to average for JDs of 2020-09-28, 2020-10-23. Plots as noted above.
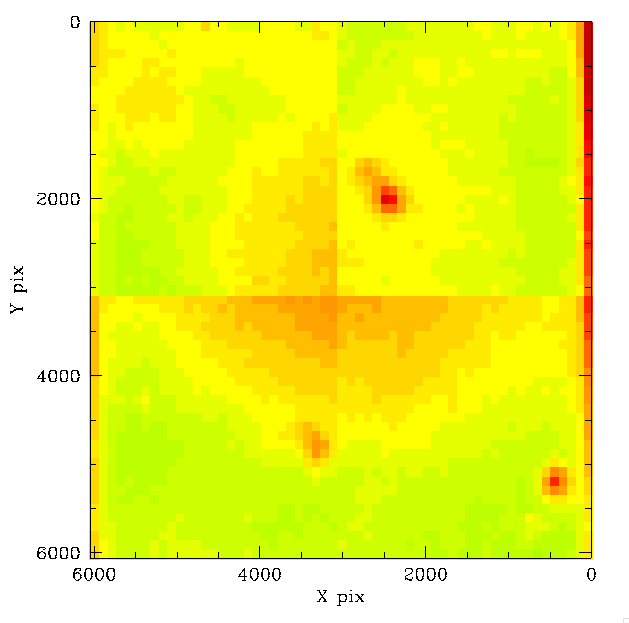
In the above plots we show the difference in g-band spatial structure relative to the average for sets of 25 nights spanning the observation range of ZTF-I. Overall the variations in photometric residual structure over time is generally < 0.1 mags. However, many of the early nights show strong variations from the average of all nights. Thus, as expected, the variations are not limited to CCD-6.
The noise in data taken between 2019-12-11 and 2020-01-18 is data due to the known "bad flat" fields taken over that time. Interestingly we see that the large dust spot seen in the earlier data is shifted after 2018-09-06 and disappears in the data averaged to 2020-08-31.
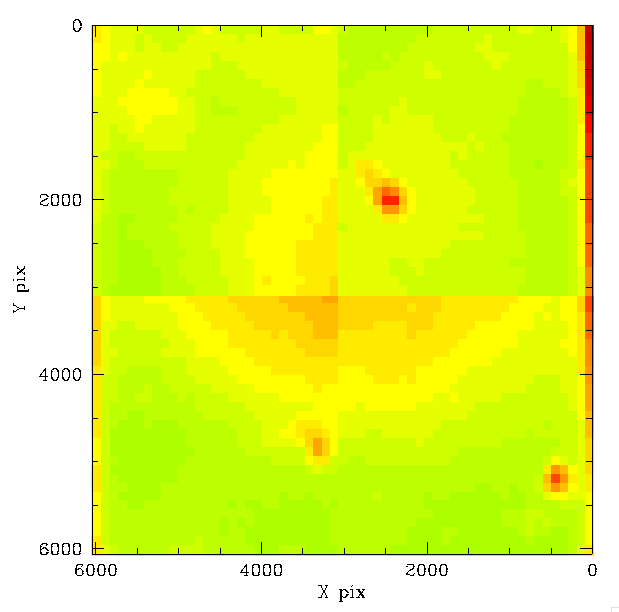
The pixel values in these combined images above appear accurate to ~2 millimag based on the level of structure that is seen in them.
In the above plot each pixel is generally the average of a few thousands measurements with mag g_inst < -7 (g ~ 19).
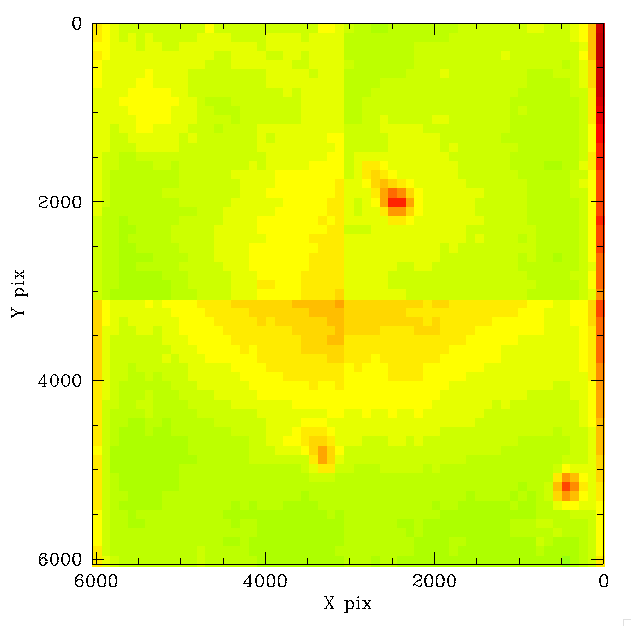
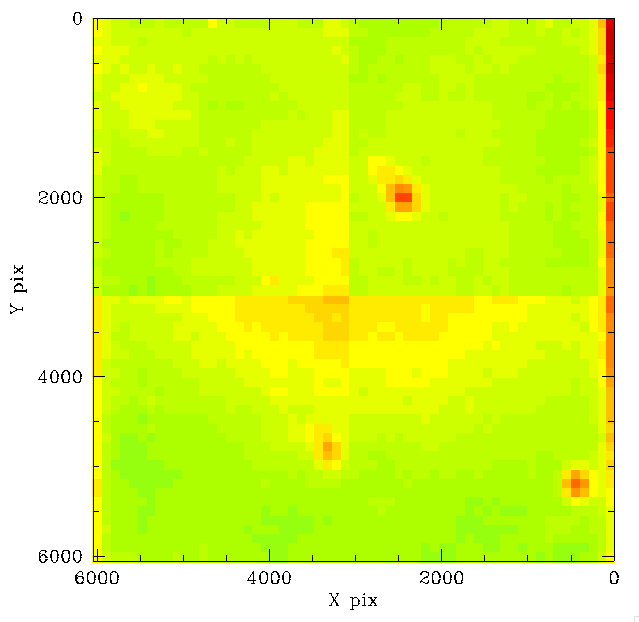
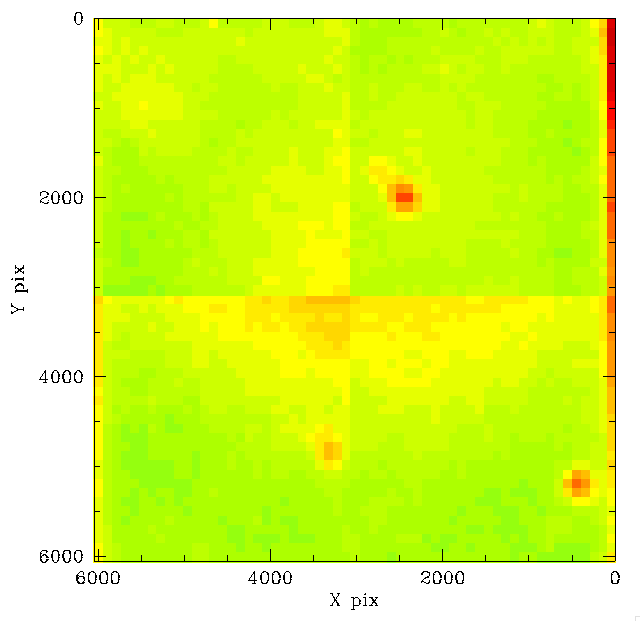
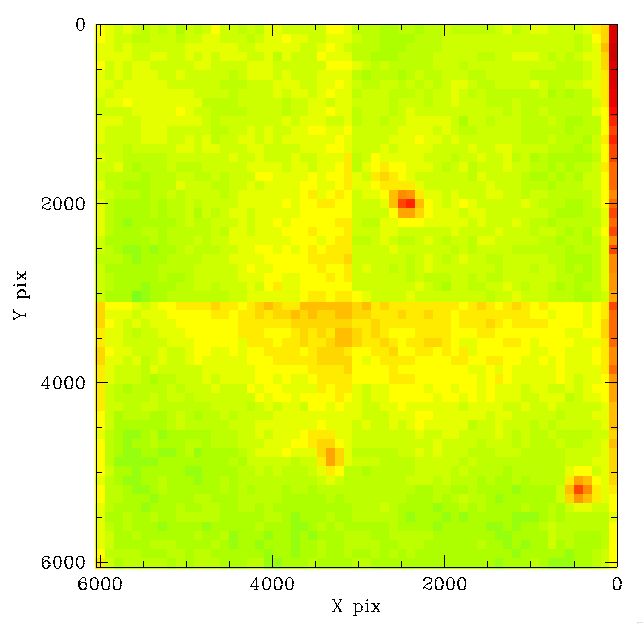
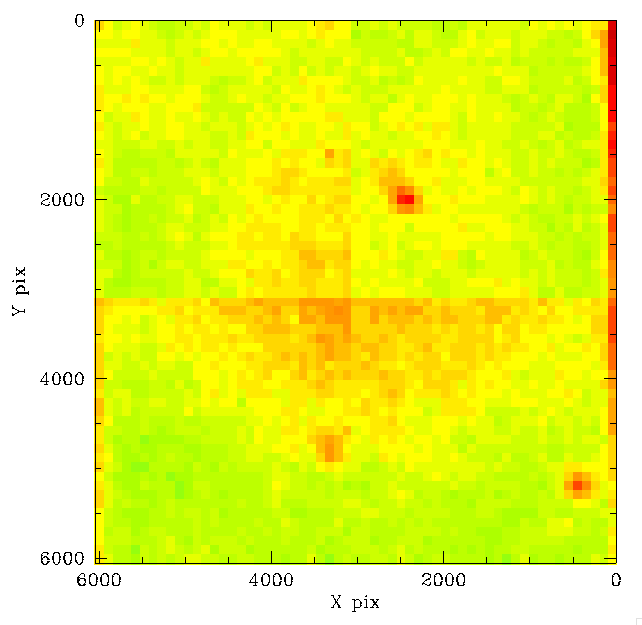
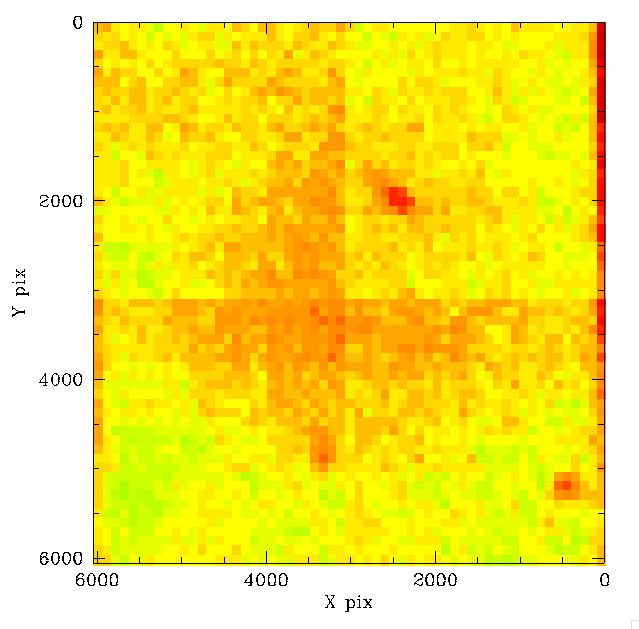
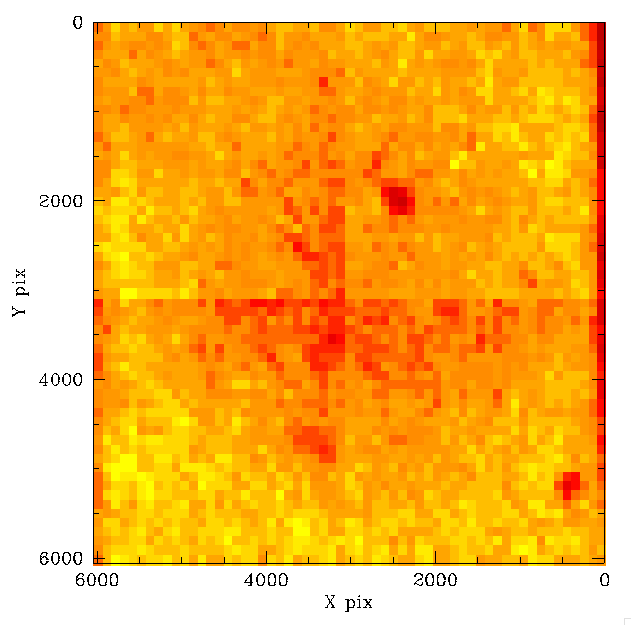
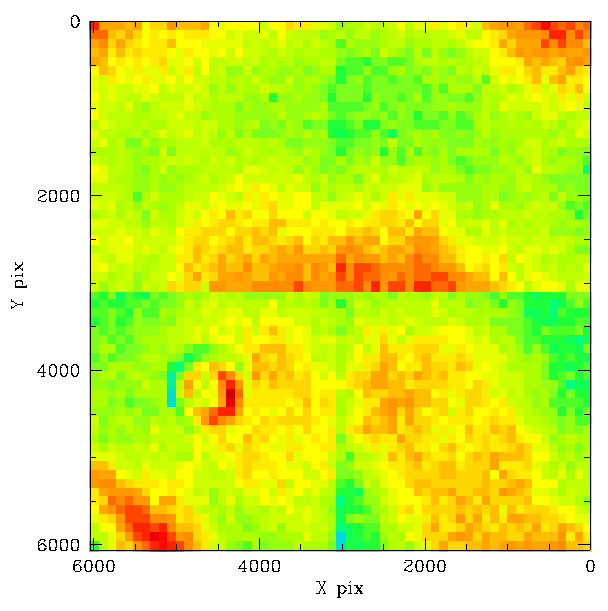
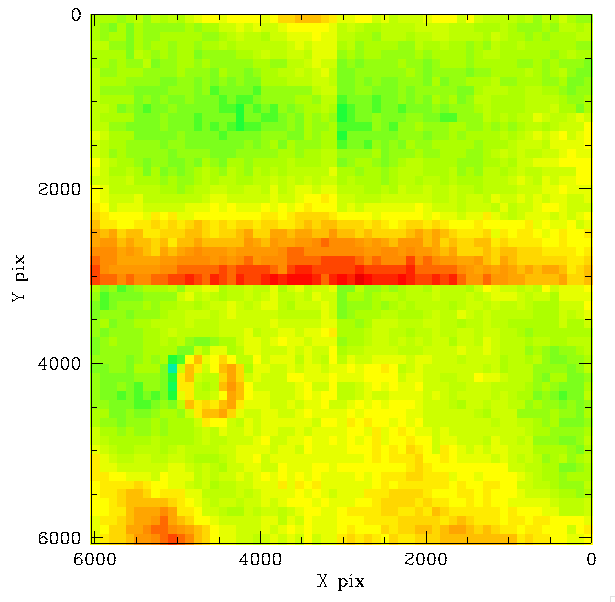
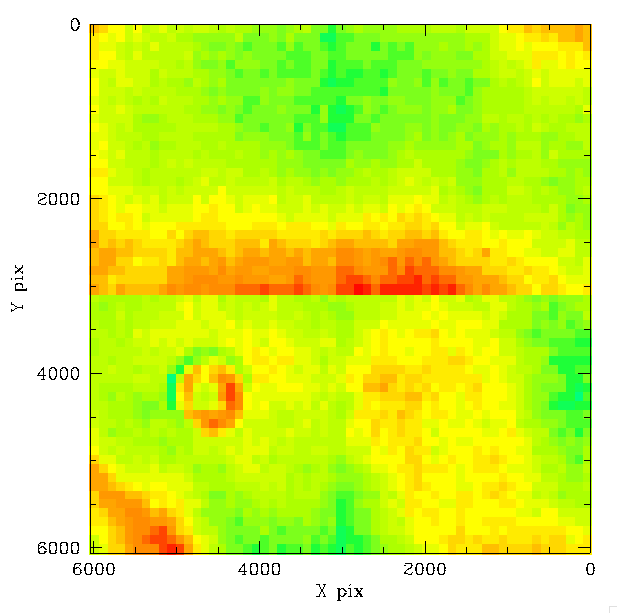
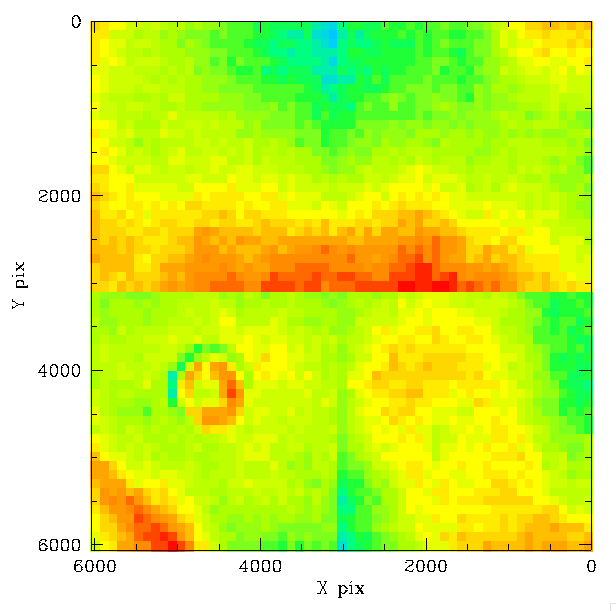
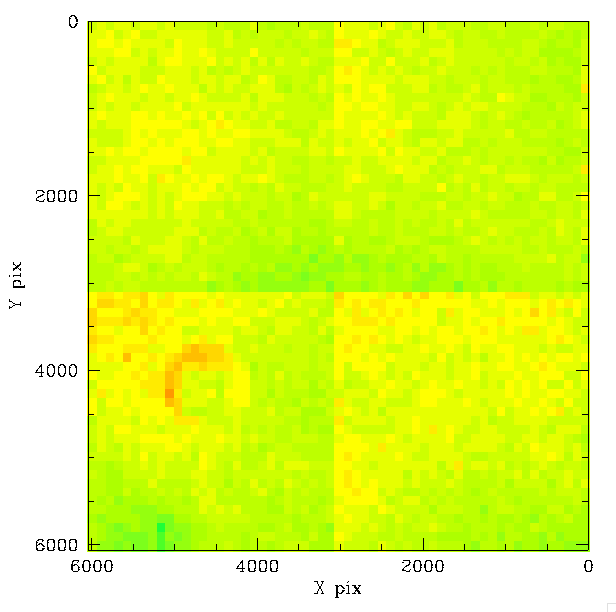
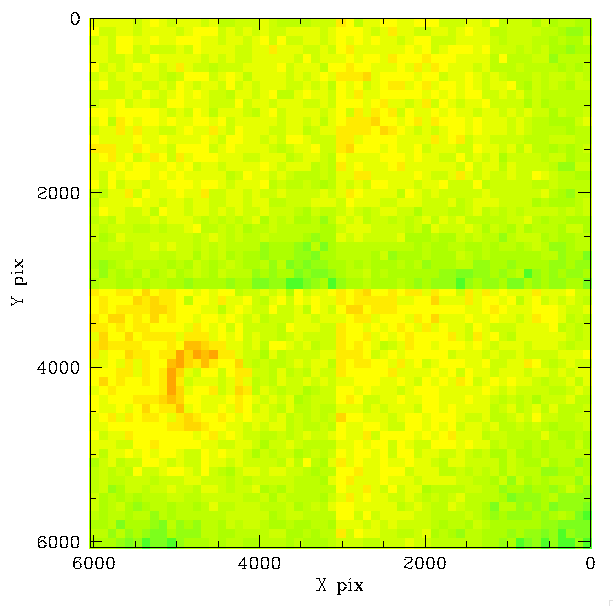
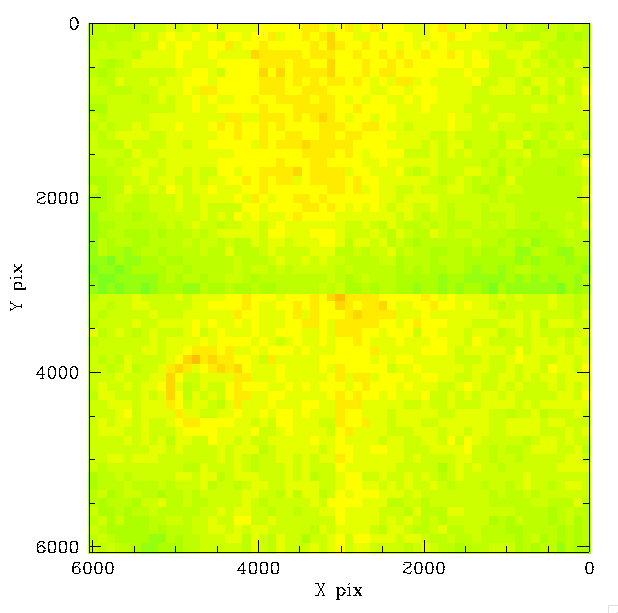
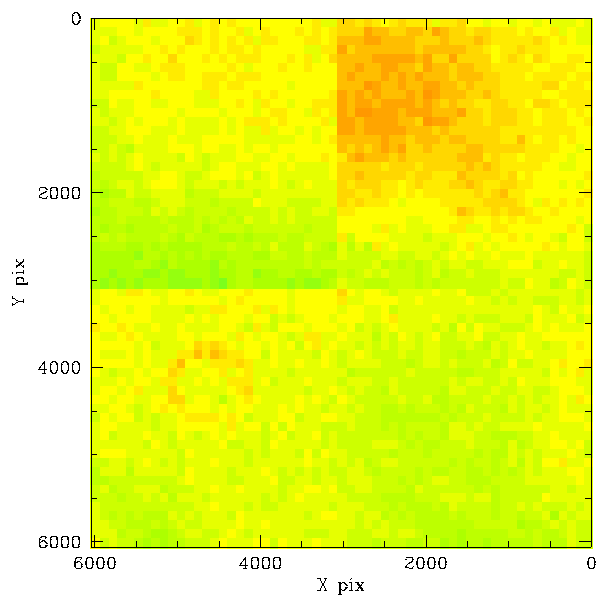
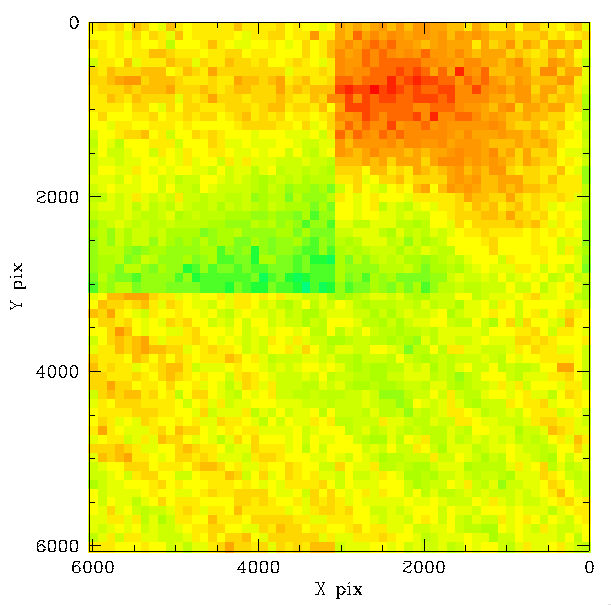
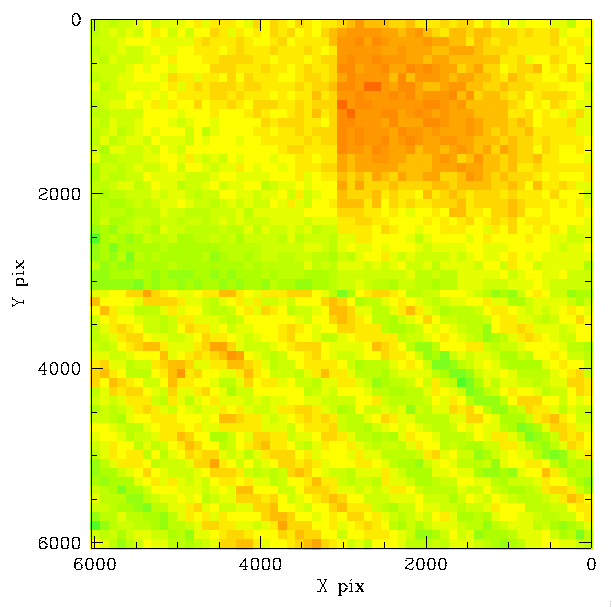
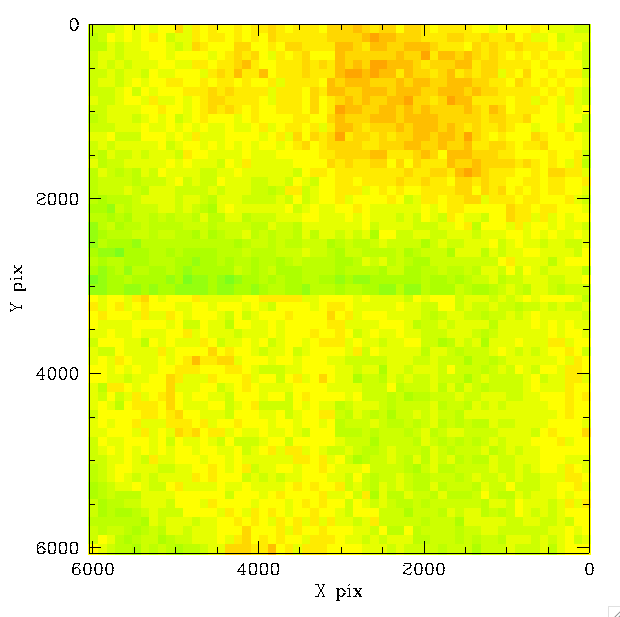
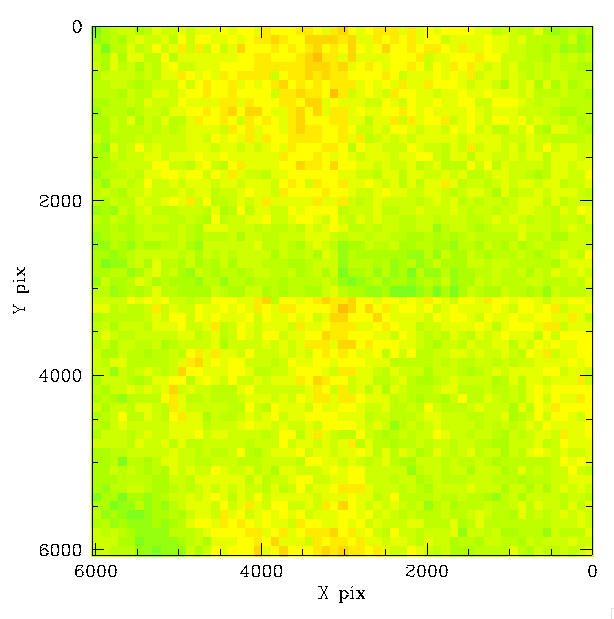
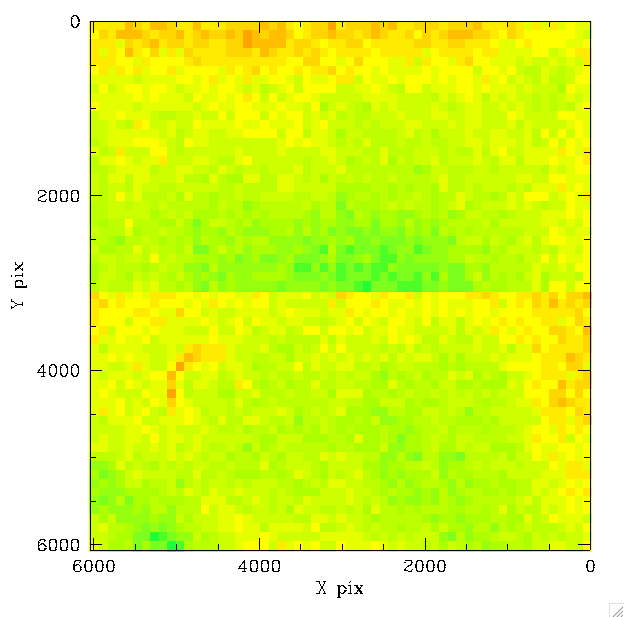
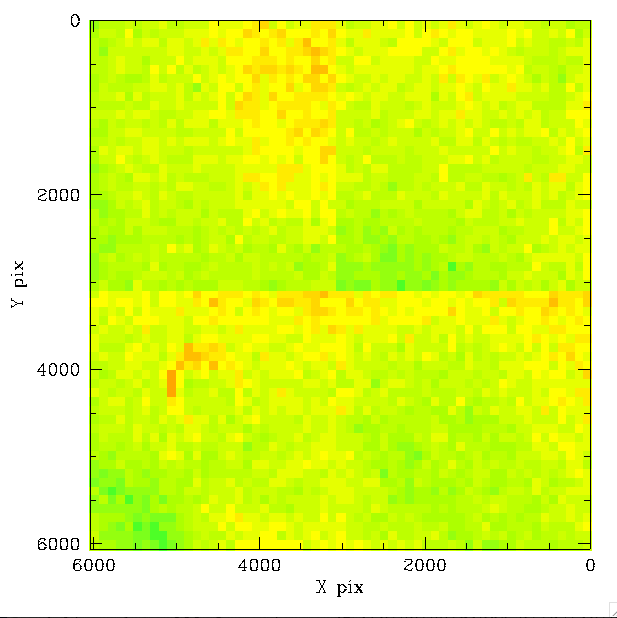
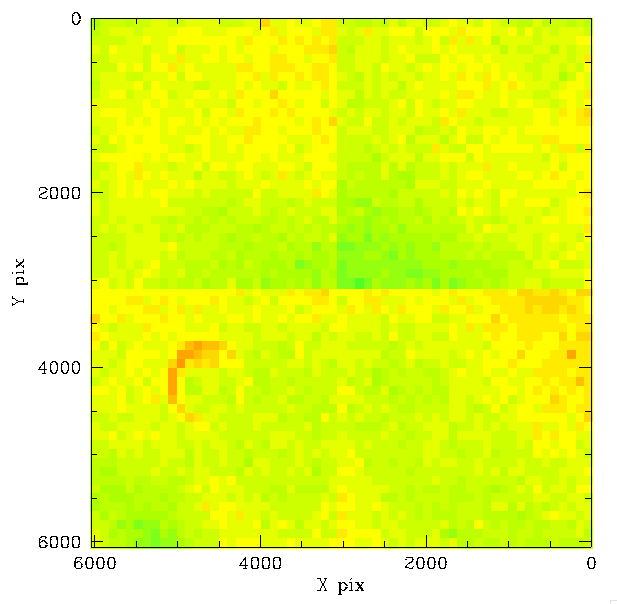
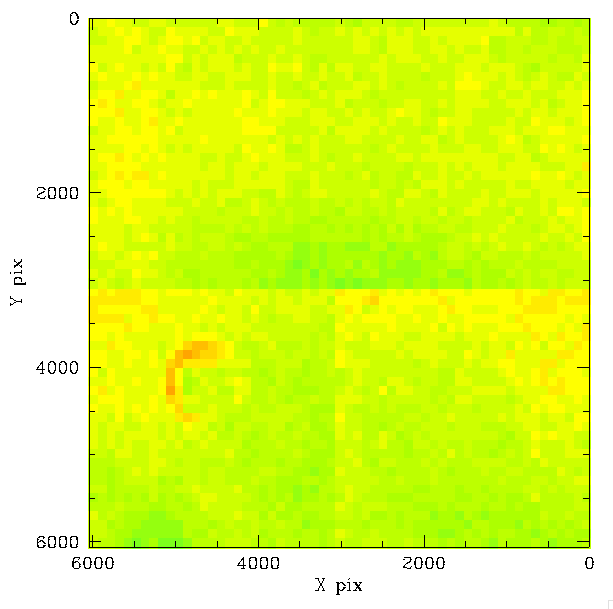
Photometric residuals at varying spatial resolution
In order to accurately calibrate all the photometry it is necessary to understand how the residual structure varies with location within a CCD. If the residual structure is simply broad features then low resolution corrections can be used. Such broad structure would allow fewer sources to define accurate corrections. However, if there is significant structure that varies on a small scale then vary large number of sources are required to determine corrections.We take the entire sets of Zubercaled data from CCD6 g-band and r-band, and CCD-7 g-band. We combine residual in each 3k quadrant image at four different scales, 30x30, 60x60, 120x120 and 205x205 bins.
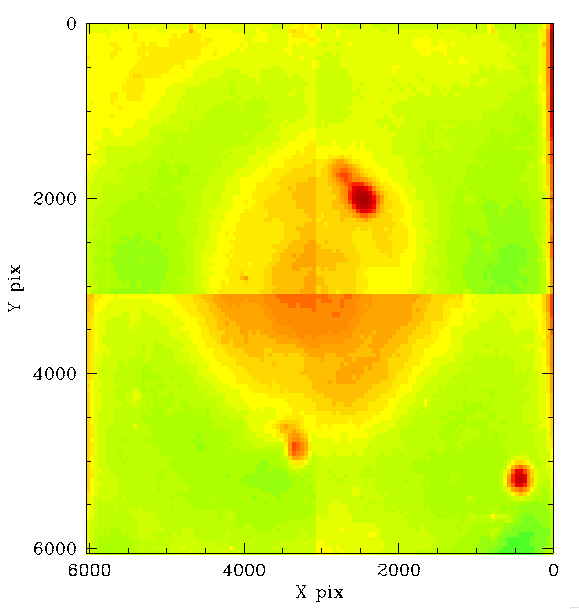
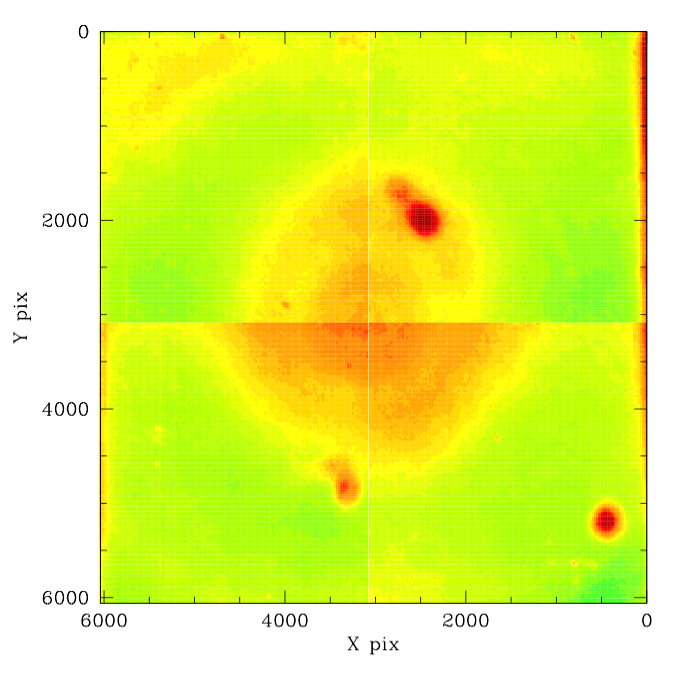
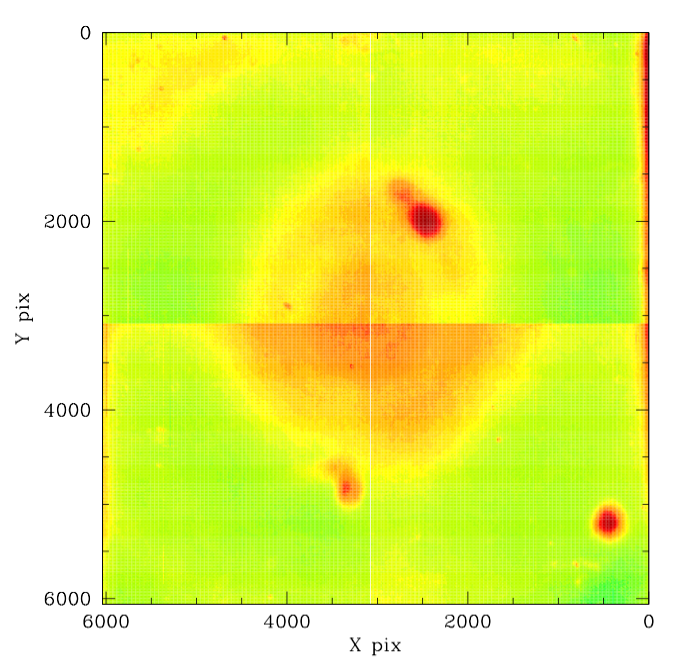

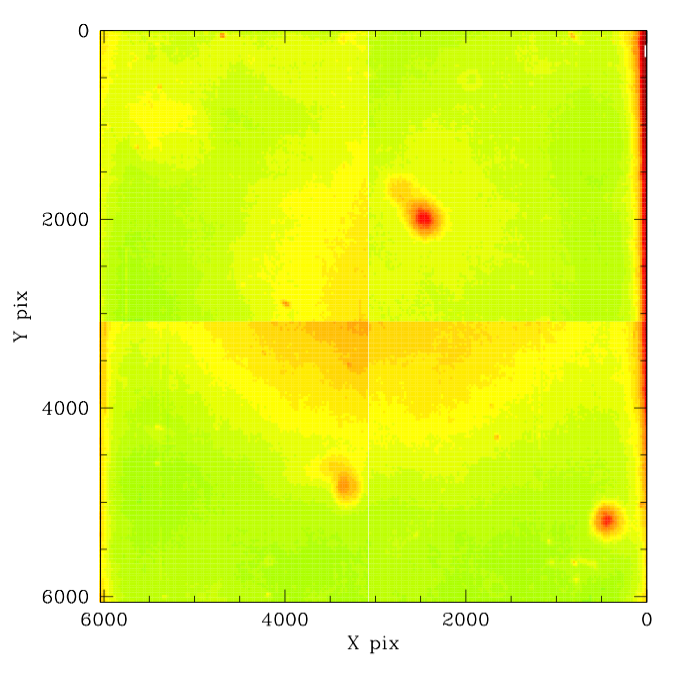

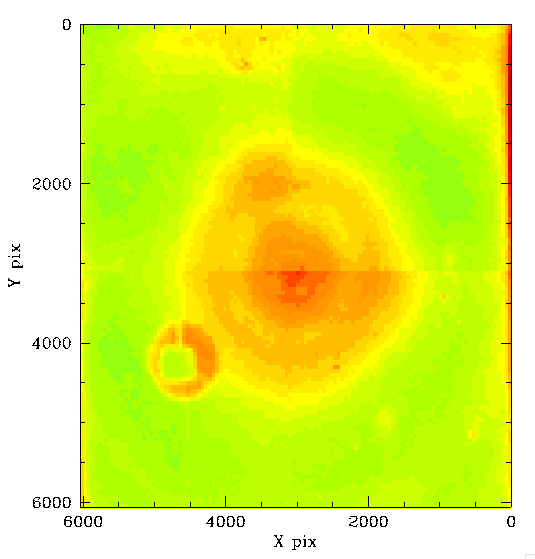
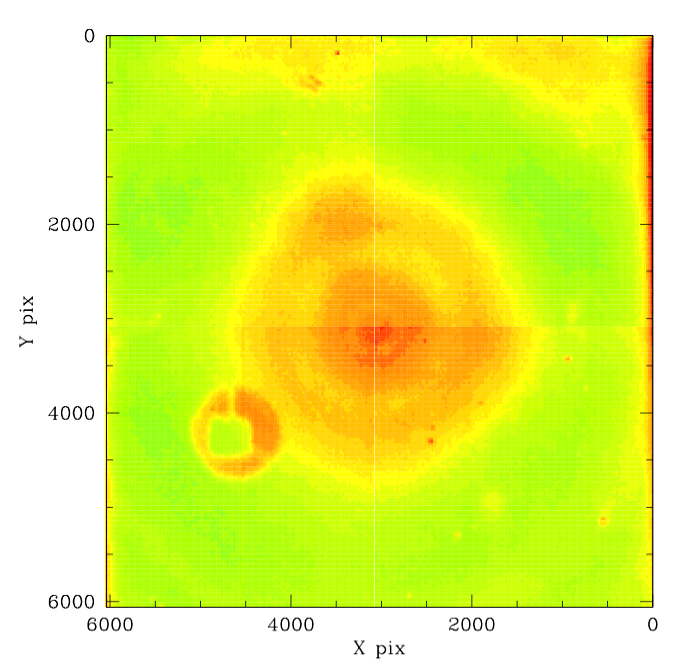
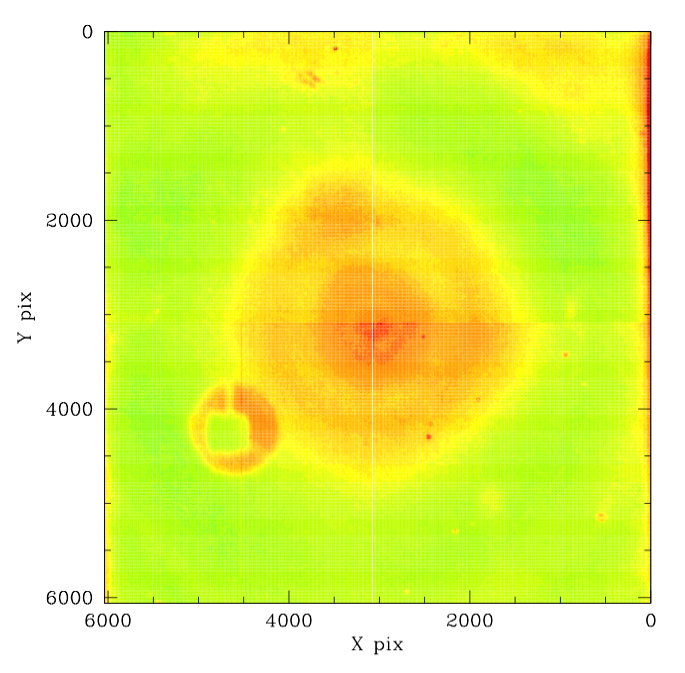
In the plots above we can see that there is some fine structure that only becomes visible when quadrants are binned 120x20. At even higher resolution there is little difference to the structure.
Discussion
We have used Zubercal to calibrate the ZTF photometry for 725 nights of r-band data and a similar additional number of g-band nights. We find that the r-band dependence on colour is the opposite of g-band and the dependence on CCD-7 g-band is very similar to CCD-6 g-band. We find that the g-band dependence on source colour in CCD-7 is consistent with that found in CCD-6.
We determine the spatial residuals on timescales of ~ 1 month (25 nights with data) for CCD-7 g-band data. Generally the level of variation is < 0.1 mags. However, some of the early nights, as well as the nights with bad flats, have larger variations. We note that the temporal variations in CCD-7 with time are as significant as CCD-6, and thus are not isolated to CCDs with poorer photometric performance.
From inspection of the photometric residuals binned to differing resolutions we see that there is fine structure that is lost at 30x30 binning. Additionally, the noise level does not increase significantly when binned 120x120 as each bins typically has ~15,000 measurements. At 205 x 205 (15 x 15 CCD pixels per bin) there are still 3,000 to 5,000 measurements per bin and little difference from 120x120. Thus, the use of either of the two higher resolutions bins appears appropriate. Increasing the resolution to 300x300 would reduce numbers to below 2,000 measurements per bin. At that level noise is likely to become evident since this is fewer measurements than from when binned 30x30 on individuals nights.