| Topics |
|---|
| Spatial structure variations in CCD-13 over time. |
| Spatial structure a varying scales. |
| Discussion. |
Variation in Spatial Structures Over Time
Following our prior work on the time dependence of spatial structure in general, and more specifically in CCD6 and CCD7 we know that there is significant variation in photometric residuals over time. We also know that those variation depend strongly on the location within a CCD.To demonstrate this we bin the spacial photometric residuals for a quadrant into 30x30 bins for each night. The residual in each bin is weighted by the photometric error. The error for each value is determined by the combined weight.
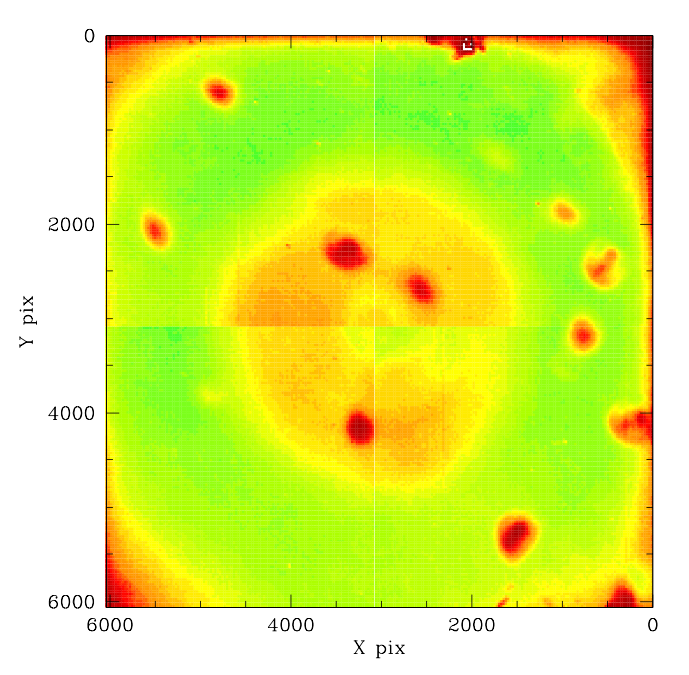
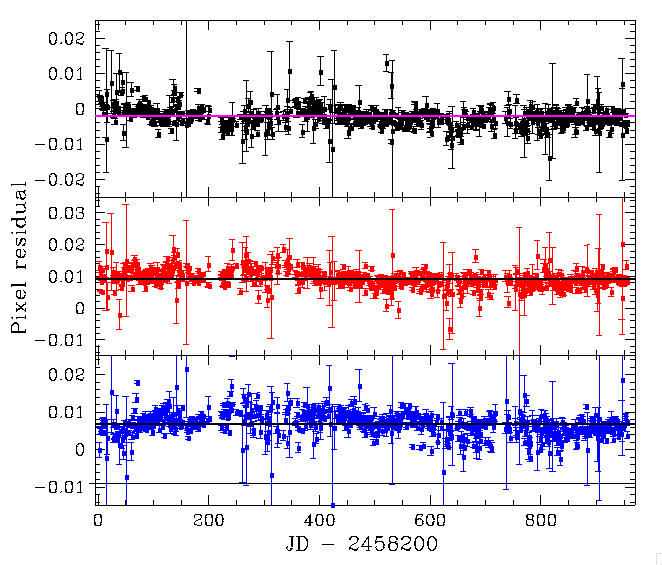
Variations in g-band calibration residuals over time for ZTF compared PS1 for CCD-13 wrt the average offset. Left: the average g-band residuals for CCD13. Right: varations in the average residuals over time at three locations. The black lines gives the value for the pixel bin with coords (10,10), the red (15,15) and the blue (20,20). The straight lines gives the average for that pixel.
In the plot above we seen the residual values in three pixels bins. Clearly the values vary in a systematic fashion over time. However, there is also variation from one pixel to another.
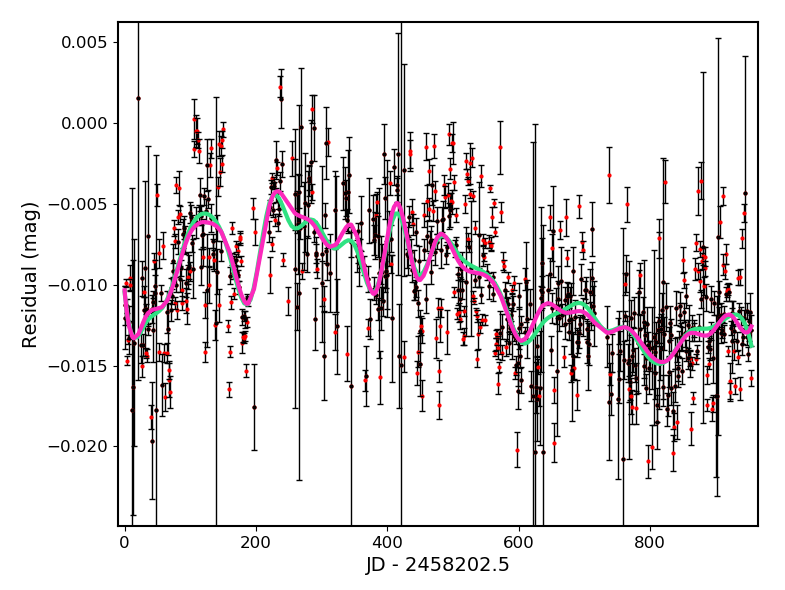
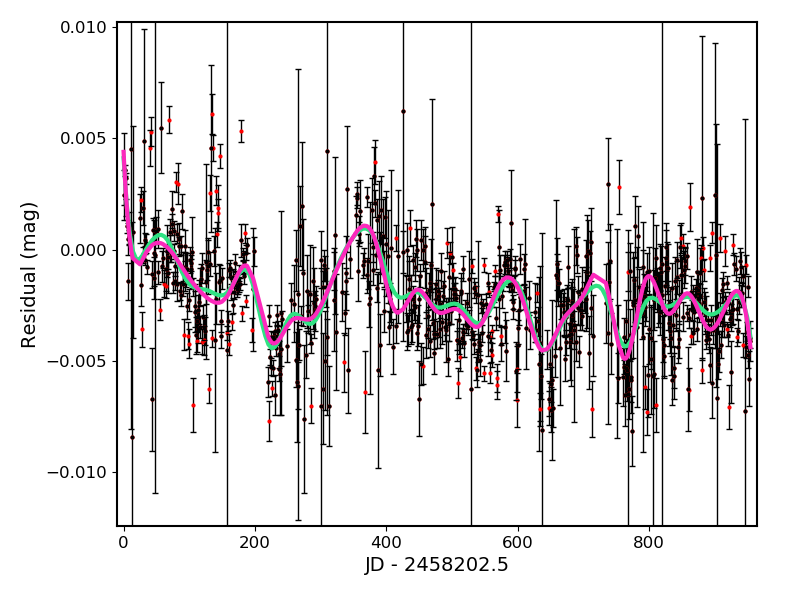
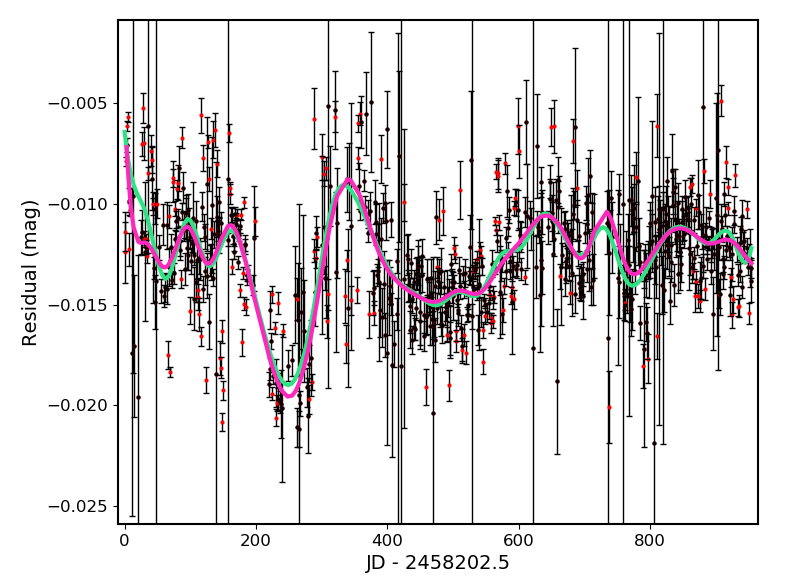
To better demonstrate the variation between pixels we show the temporal behaviour in three widely-spaced regions. In each case perform a spline fit to the data with knots spaced 30 days apart (green line). We chose this 30 days spacing since there is every expectation that the lunar cycle will effect the photometry in some way. We sigma clip the data and refit it (magenta line). In some cases (such as pixel 5,5) we see that there is significant variation beyond that expected purely from the photometric errors.
Structure in adjacent pixels
For comparison with the above widely-separated pixel positions, we compared the temporal structure for some sets adjacent pixels.
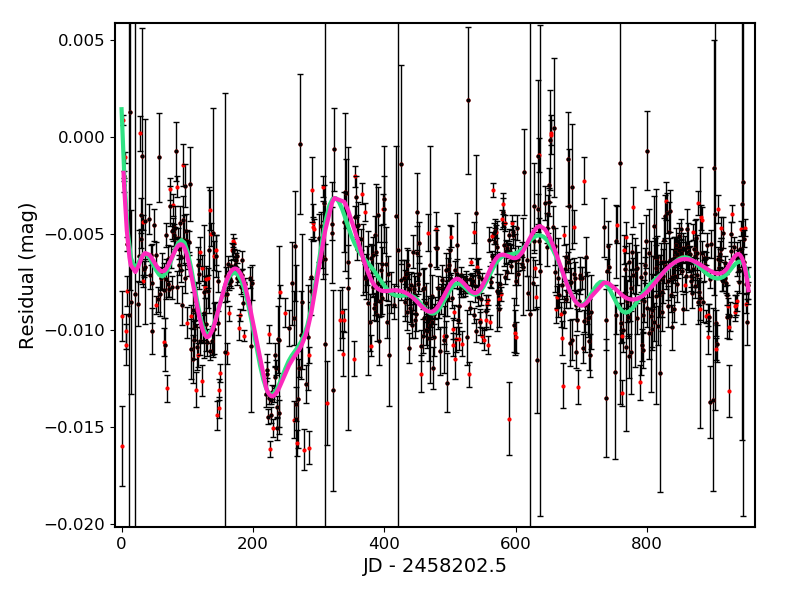

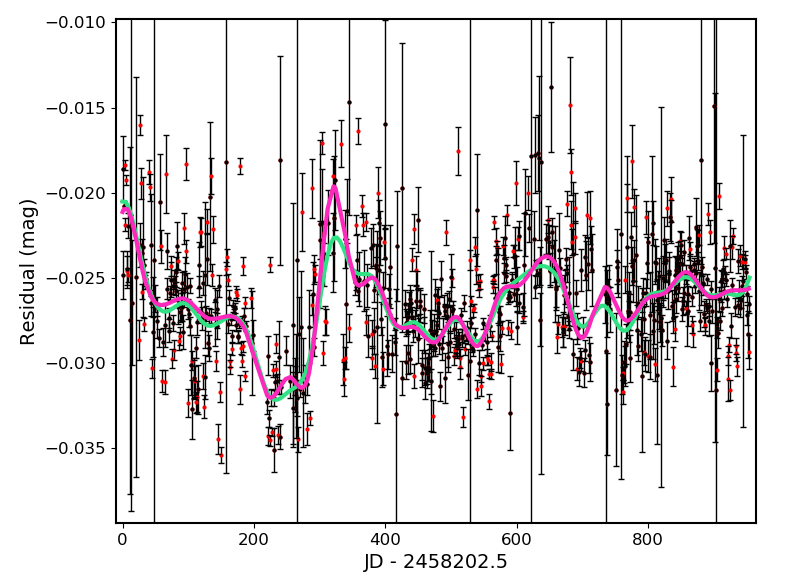
In the plot above we show the variation in temporal structure near the lower edge of quadrant one. Here we see that the structure in adjacent pixels is relatively consistent as expected.
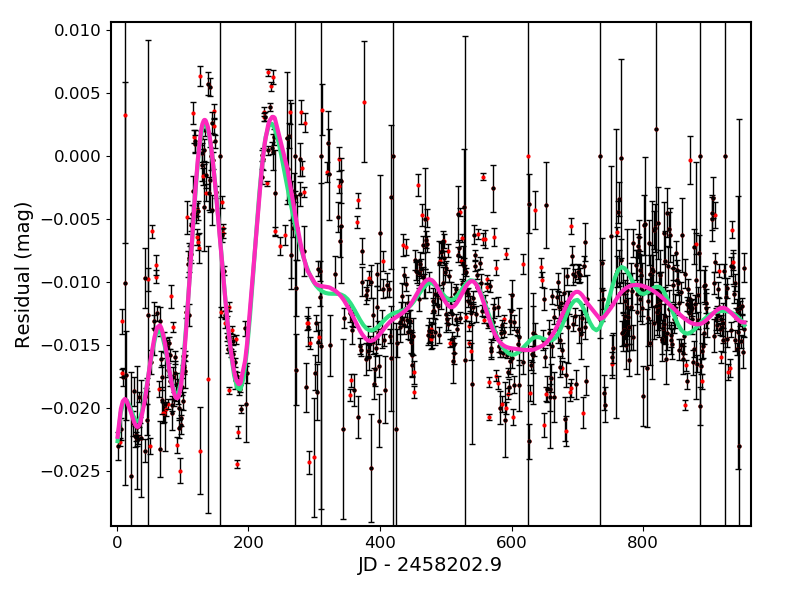
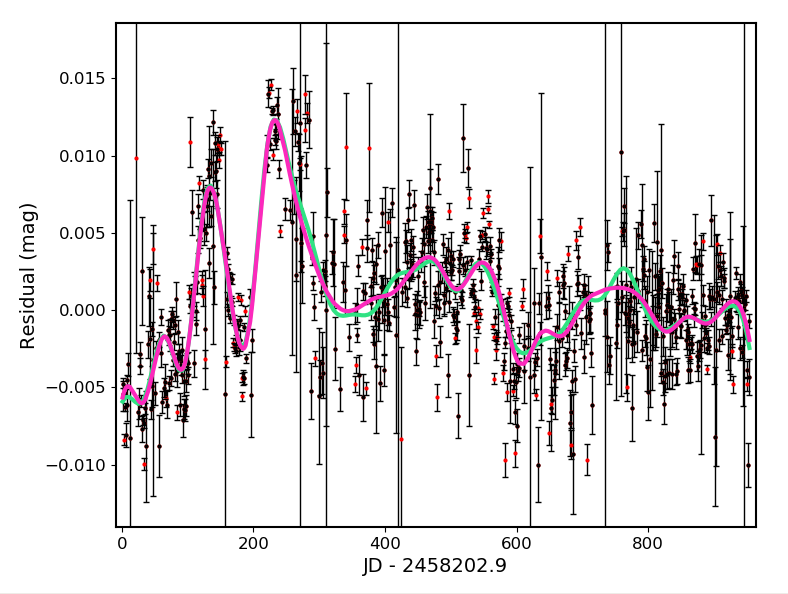
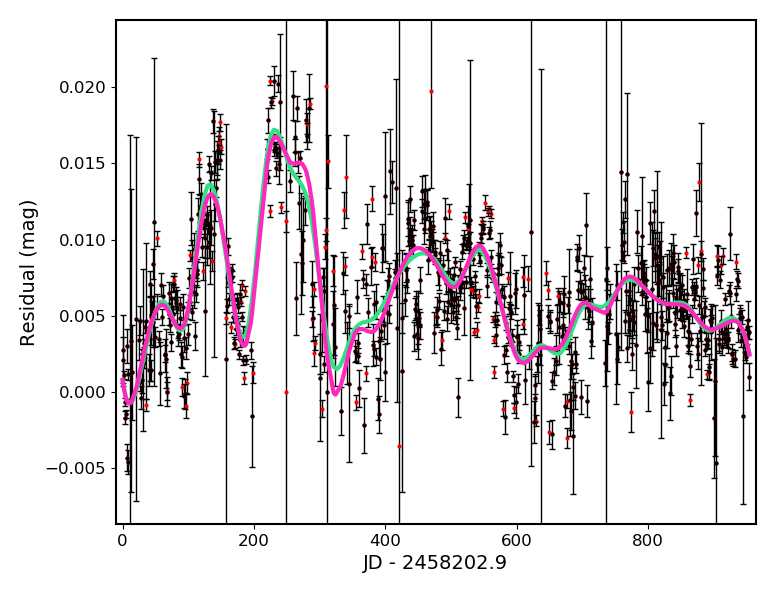
In the plot above we show the variation in temporal structure near the very near edge of quadrant four. Here there is significant structure since edge pixels are affected by reflections off the CCD holder. As with the examples above, the structure is also relatively consistent between pixels.
Discussion
In the plots above we have confirmed that there are significant temporal variations in the underlying residuals across a quadrant. As expected, this structure is correlated across adjacent pixels. This correlation strong suggest that the variations are real, Rather than simply
The temporal variations at a given location are typically a few millimags.
In a number of cases we see large variation from one day to the next. We have clipped most of these points. However, it is possible that some of that structure is indeed real, and that real short-timescale variations are occuring. This requires further investigation.