| Topics |
|---|
| Uncertainties in CCD6. |
| Testing variations in colour response. |
| Testing variations in ZTF photometry. |
| Checking parameters in other CCDs. |
| Further tests on nightly photometry. |
| Probable gain variations in CCD6. |
| Discussion. |
Increasing Photometric Uncertainties in CCD6
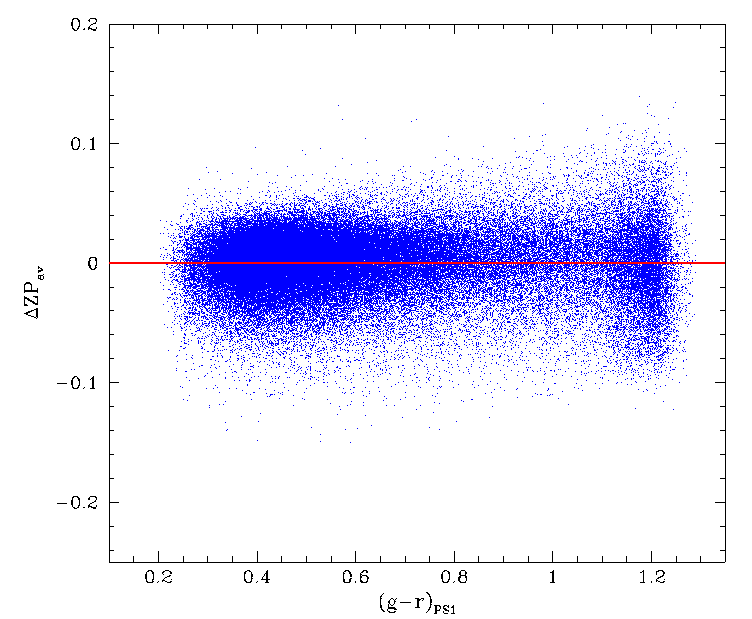
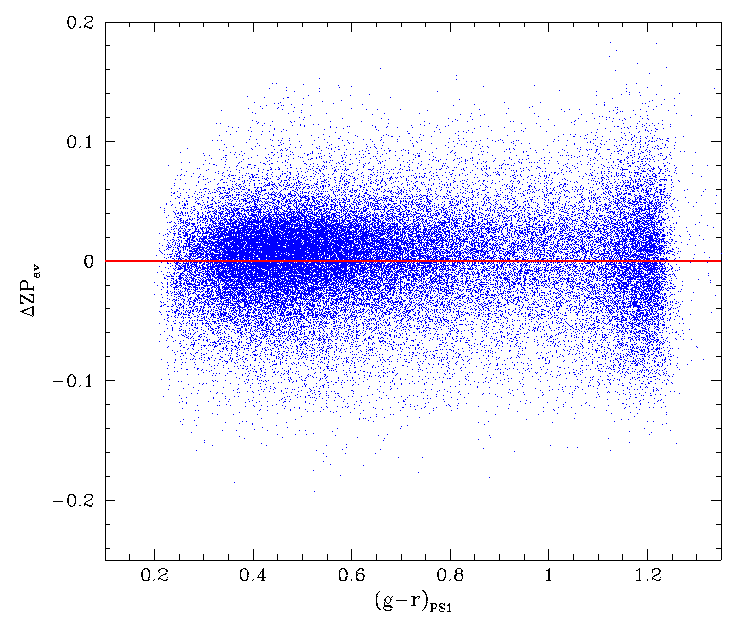
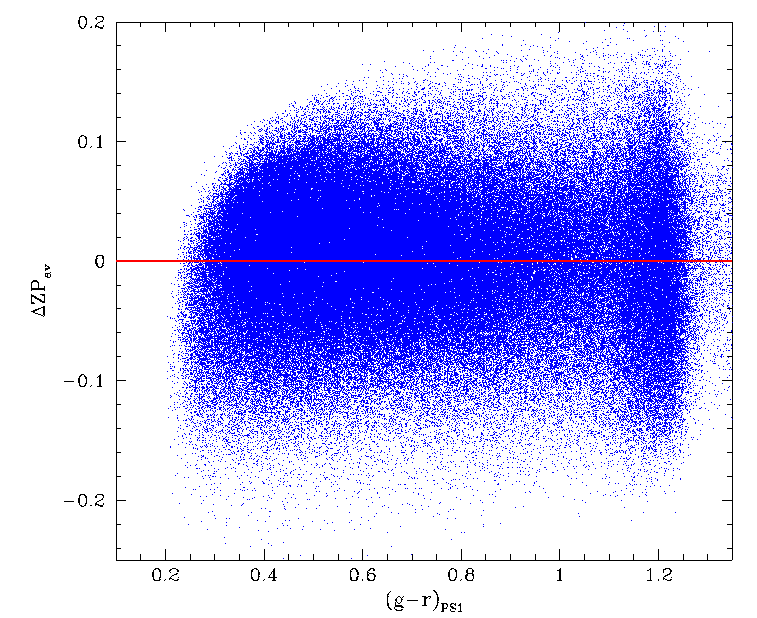
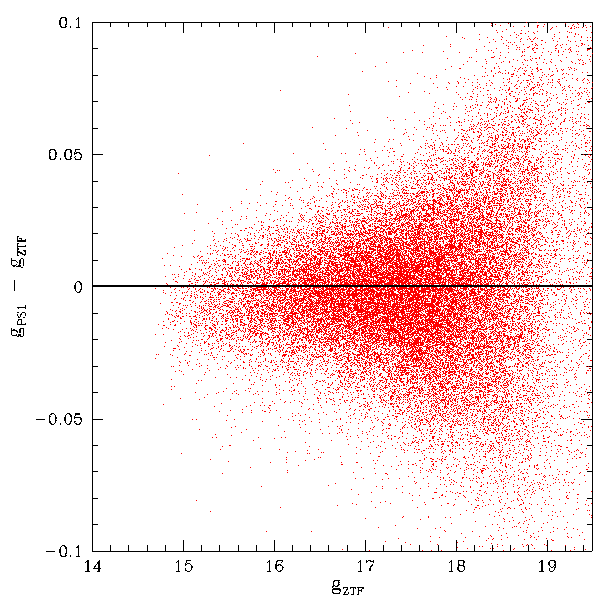
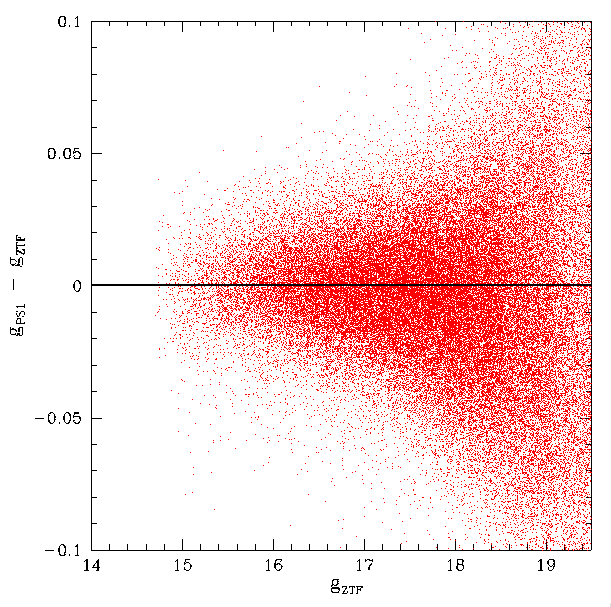
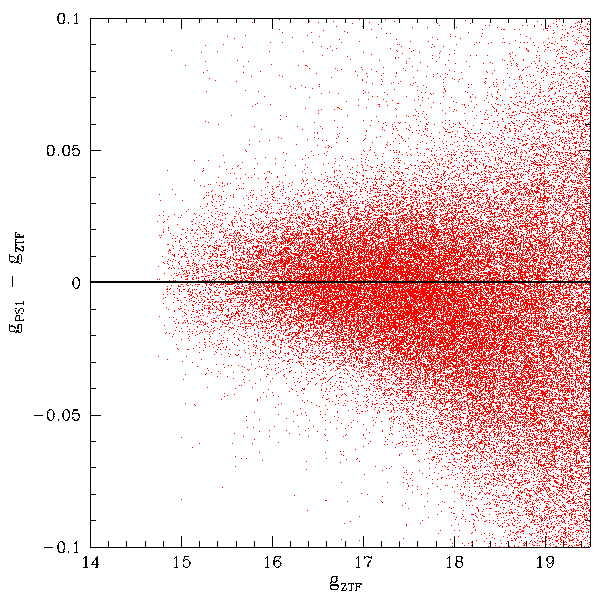
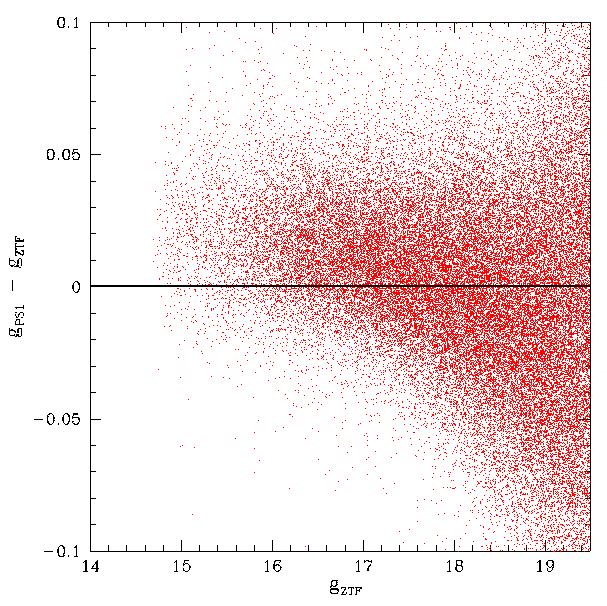
Analysis of ZTF photometry shows that the structure of spatial residuals has changed over time. In particular, analysis by F. Masci shows that structure of variations between ZTF and PS1 have increased significantly within CCD 6.
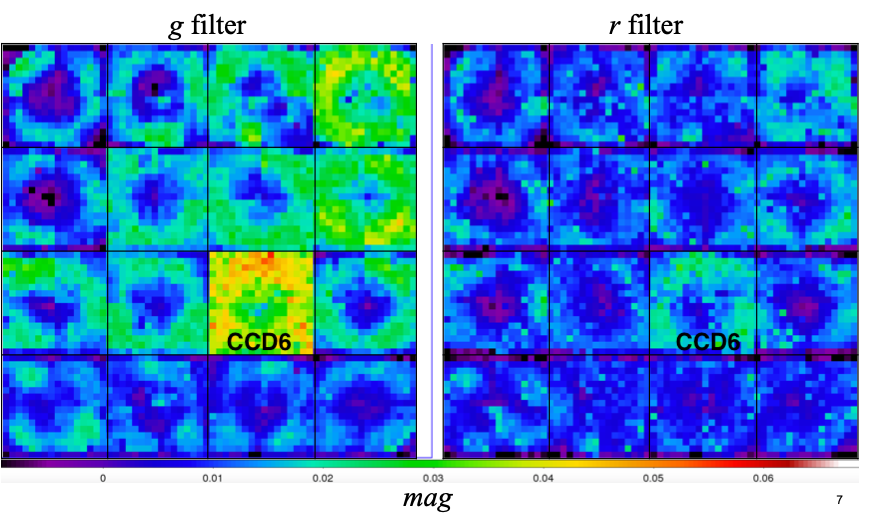
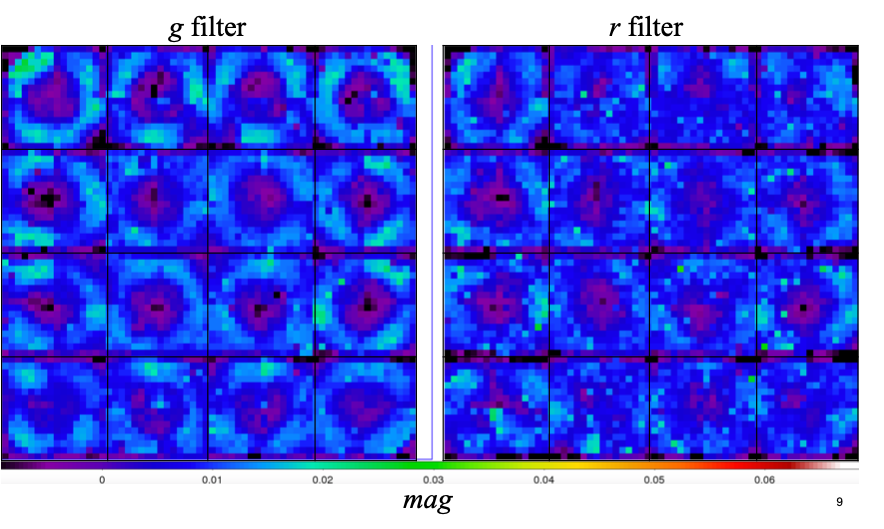
In the plots above we clearly see that the residuals in CCD 6 have increased significantly and that the variation is much stronger in g-band.
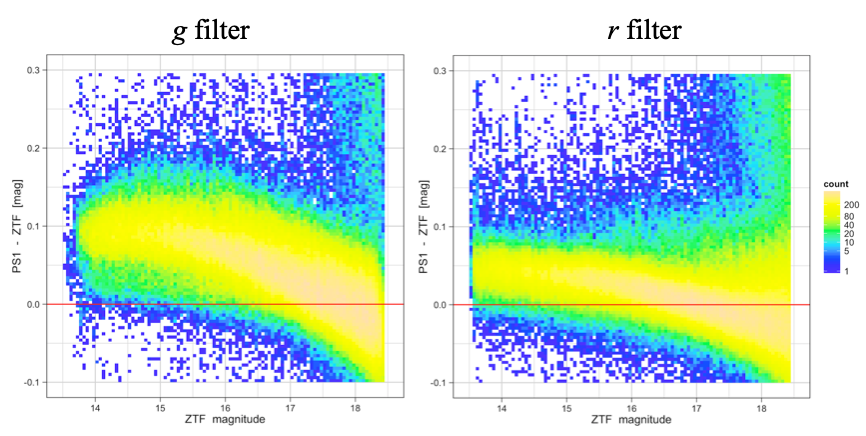
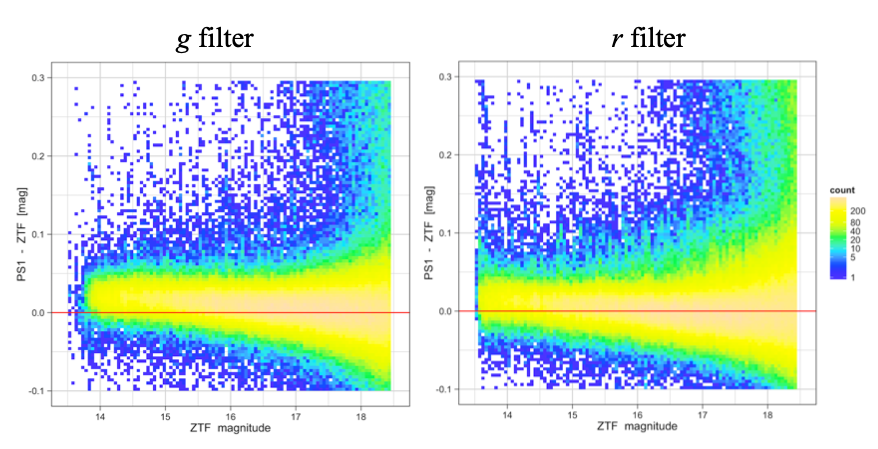
In the plots above we see that the 2020 photometry for CCD 6 exhibits a much stronger magnitude bias compared to PS1 photometry than the 2019 data.
Testing for variations in ZTF CCD colour response
It was suggested by F. Masci that may now be a severe colour-dependent nonlinearity within the photometry such that the current single ZP plus colour term per quadrant is unable to fit the data.It is possible to use flats taken with different LEDs to determine the general colour reponse of a CCD. For example, there is a clear variation in the wavelength dependence of the ZTF CCD response for r-band and i-band. For CCD 01, the r-band response has been found to be essentially constant with time.
Using this same idea we take the ratios of flats take with g-band LEDs 2 and 5 for 2020-06-26 and 2019-06-26. As a comparision we also look at CCD 5 which is much less affected by photometric variations in the 2020 data.
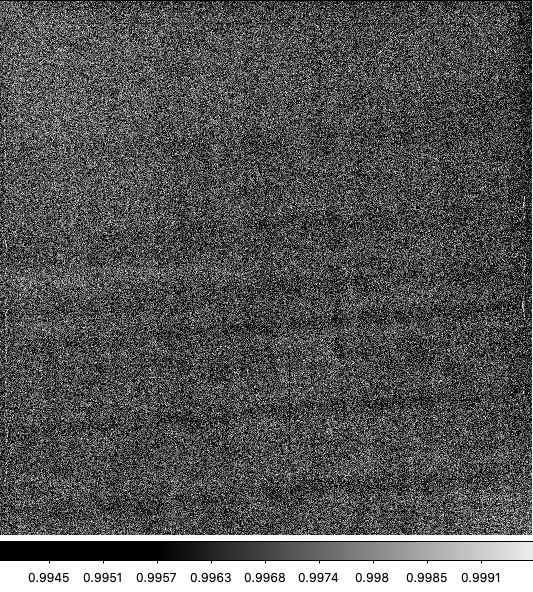
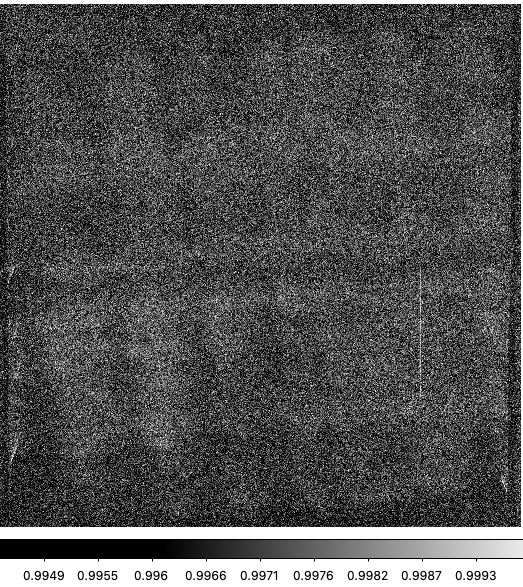
In the plot above we show the ratios of the 2020-06-26 to 2019-06-26 data for CCDs 5 and 6. Here we see that while there is some low level structure within the binned images, it is not significant at the level of the photometry and does not follow the circlar structure seen with the photometric residuals. There is no evidence for a variation in the the ZTF CCD response.
Testing for variations in ZTF photometry
Since the variations are seen within the photometry it is naturally expected that the photometric calibration themelves will exhibit the variation. We extracted photometric data such as the frame values of ZP, colour coeff, seeing, ellipticity, sky level, nPSFcat and PSF fit chi. The data were taken for the period from 2018-03-25 to 2020-03-09 for which we archival exposure data available. Since CCD 7 is seen to behave well in comparison to CCD 6, we use this as a comparison.
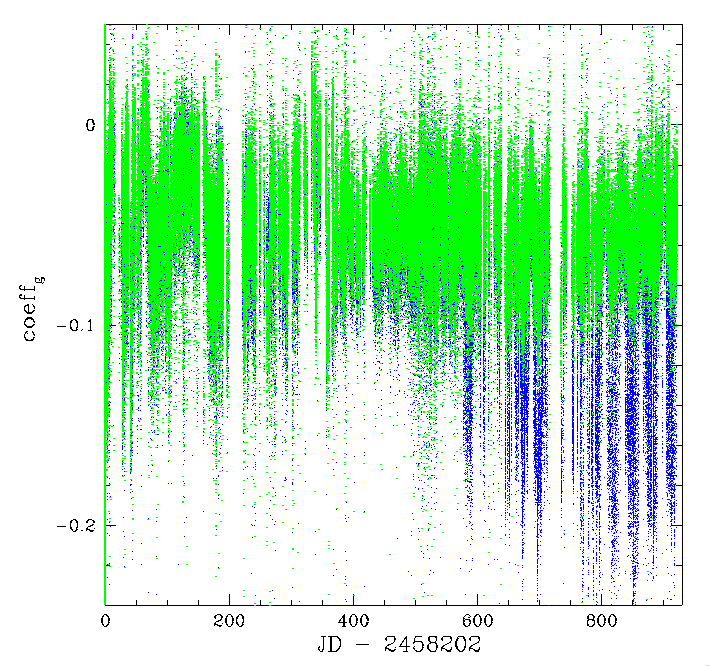
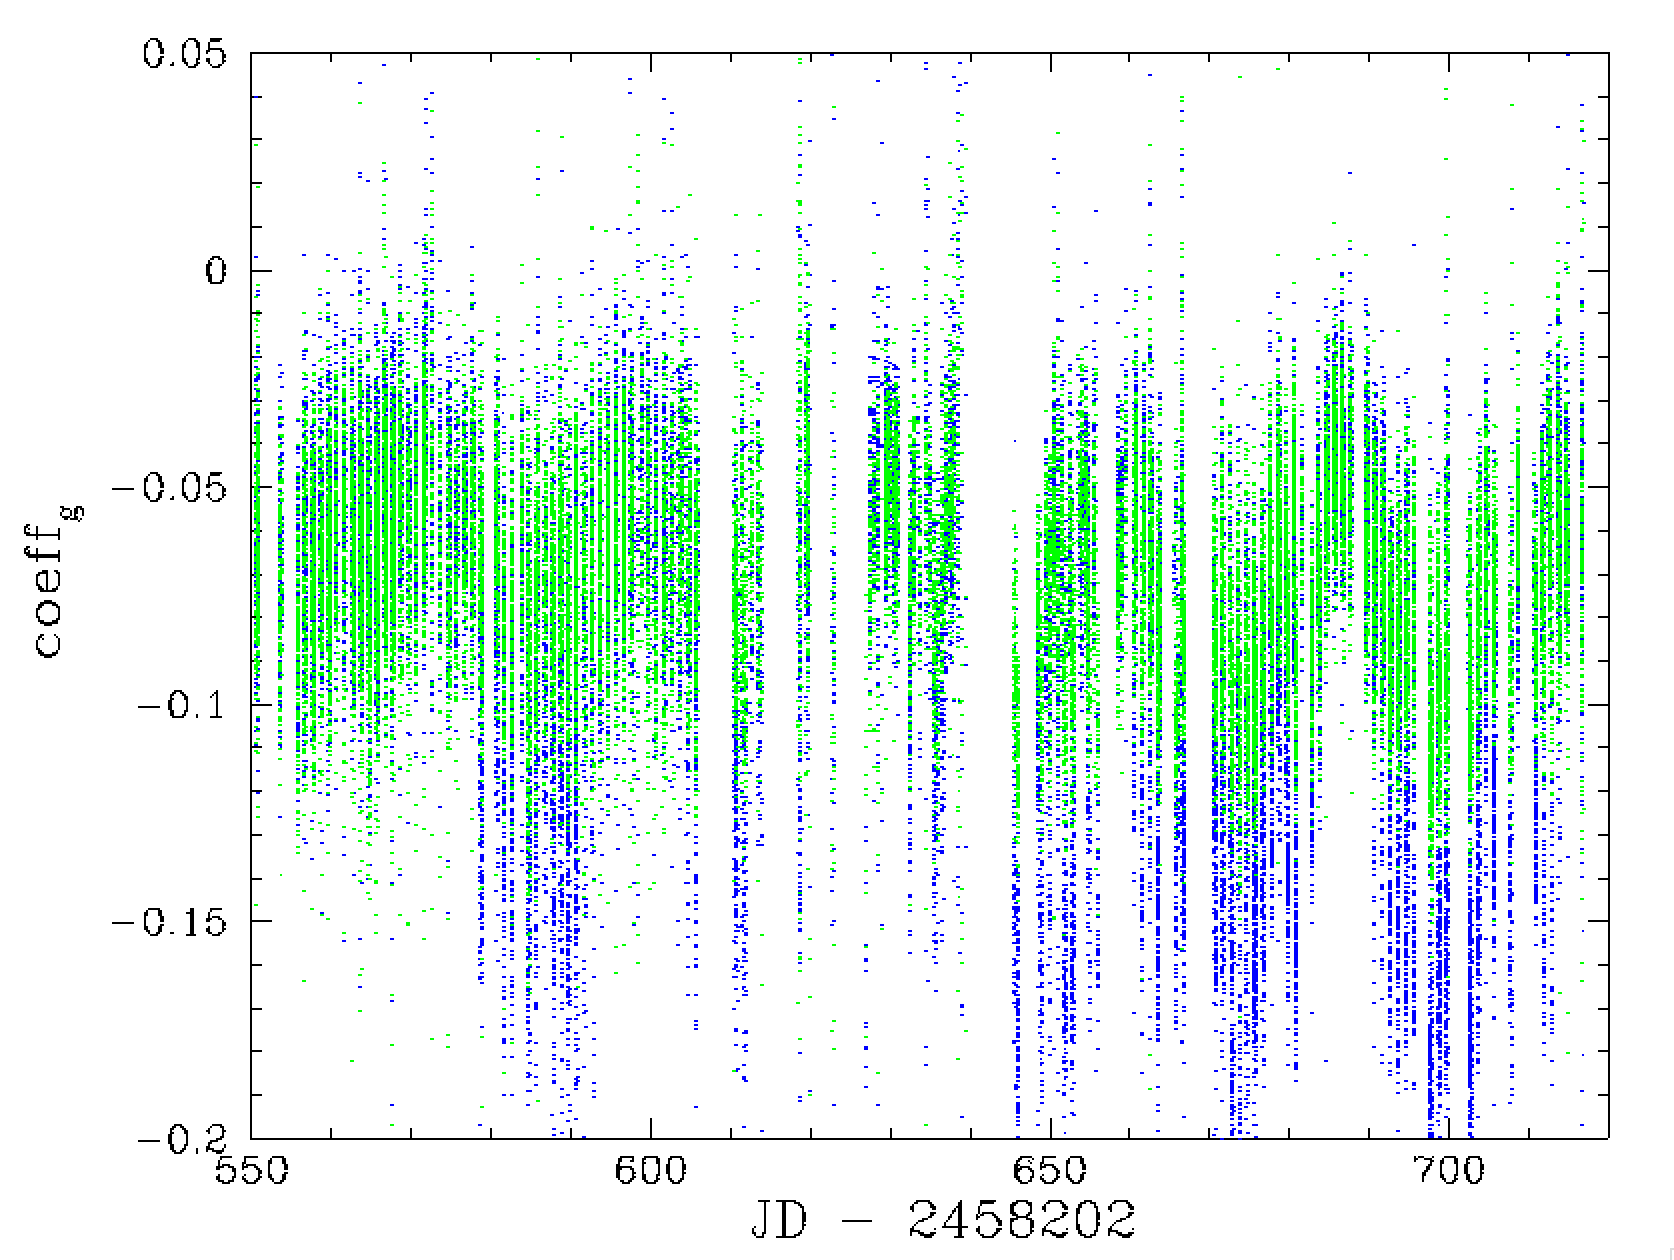
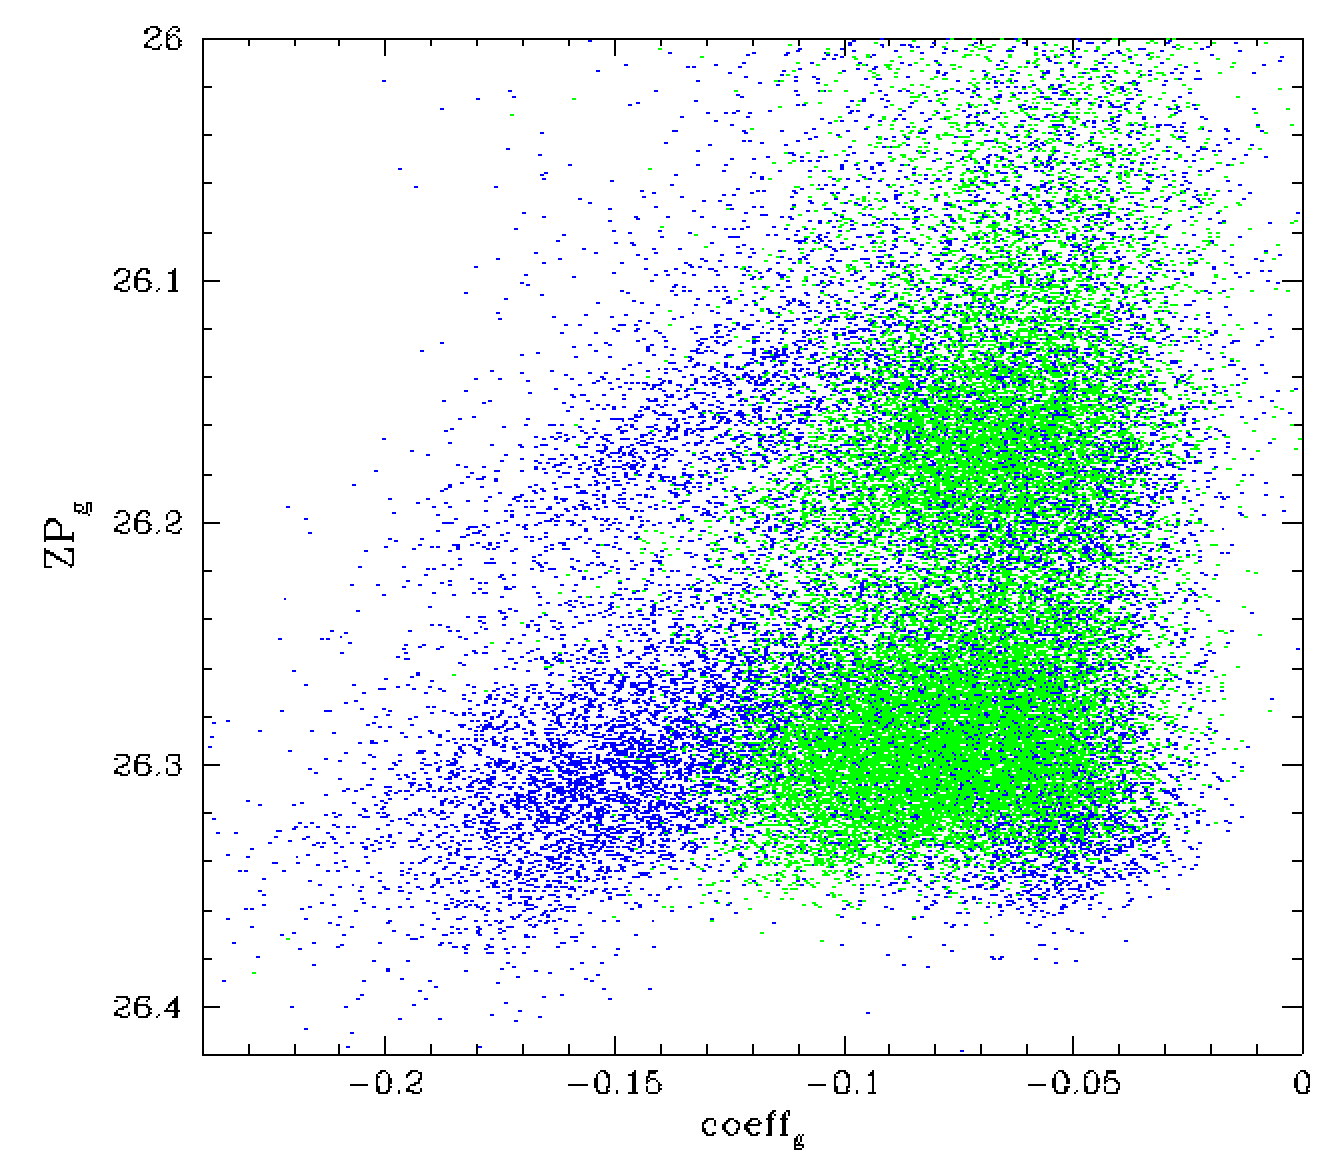
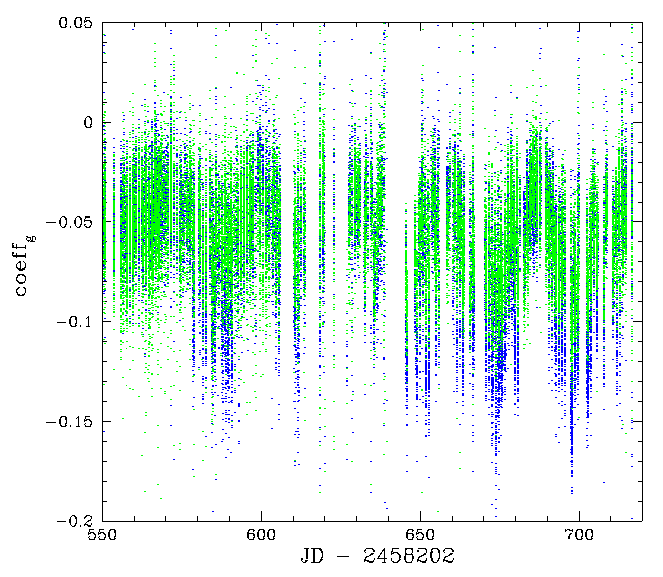
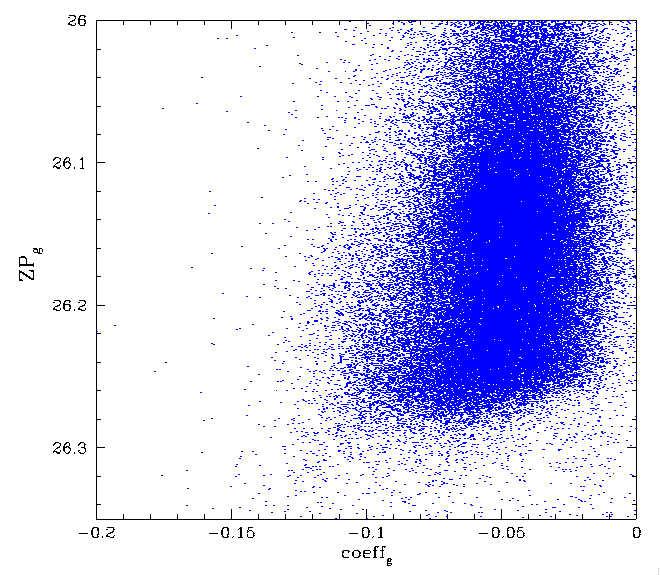
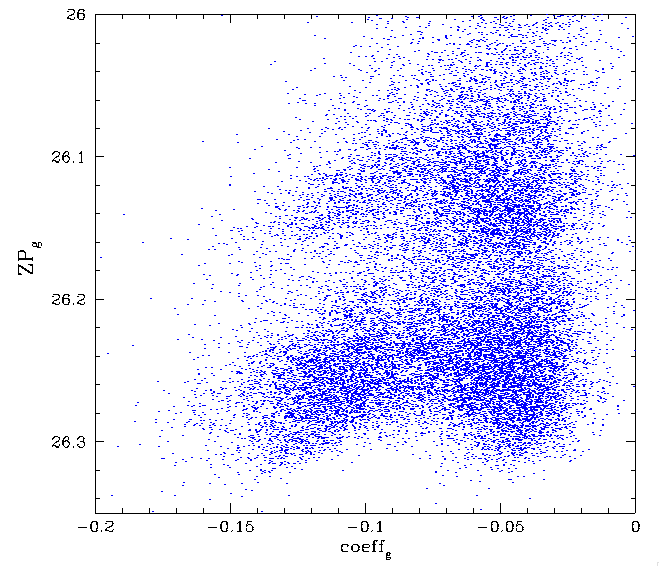
In the plot above we see that the colour coeffs for CCD 7 q1 and CCD 7 q1 are very similar (as expected) up until day 579 (date 2019-10-23). Here the colour coefficients diverge and the CCD 6 values are inconsistent with the 125,000 g-band frame previously analyized. Values of g-band colour coeff less than approx -0.12 suggest a significant change in the system. No obvious trend were found within the ZP time distribution. However, these values vary significant with time, making any ZP analysis difficult.
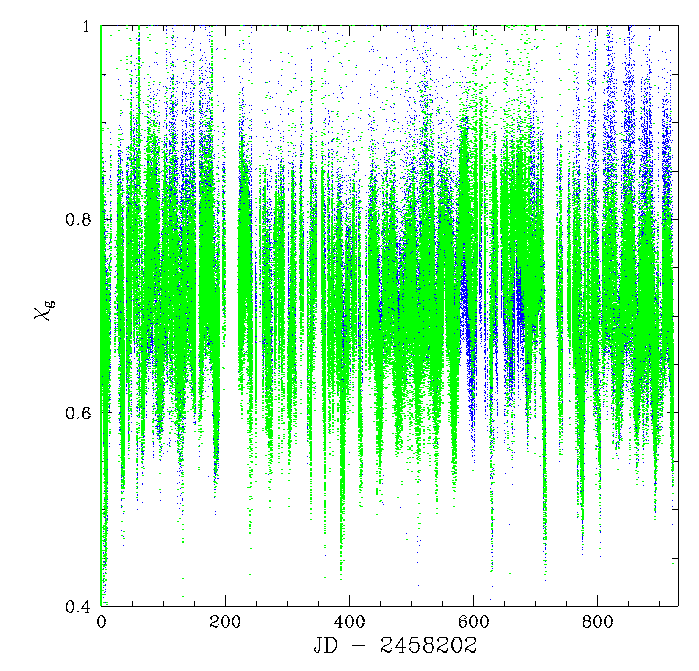
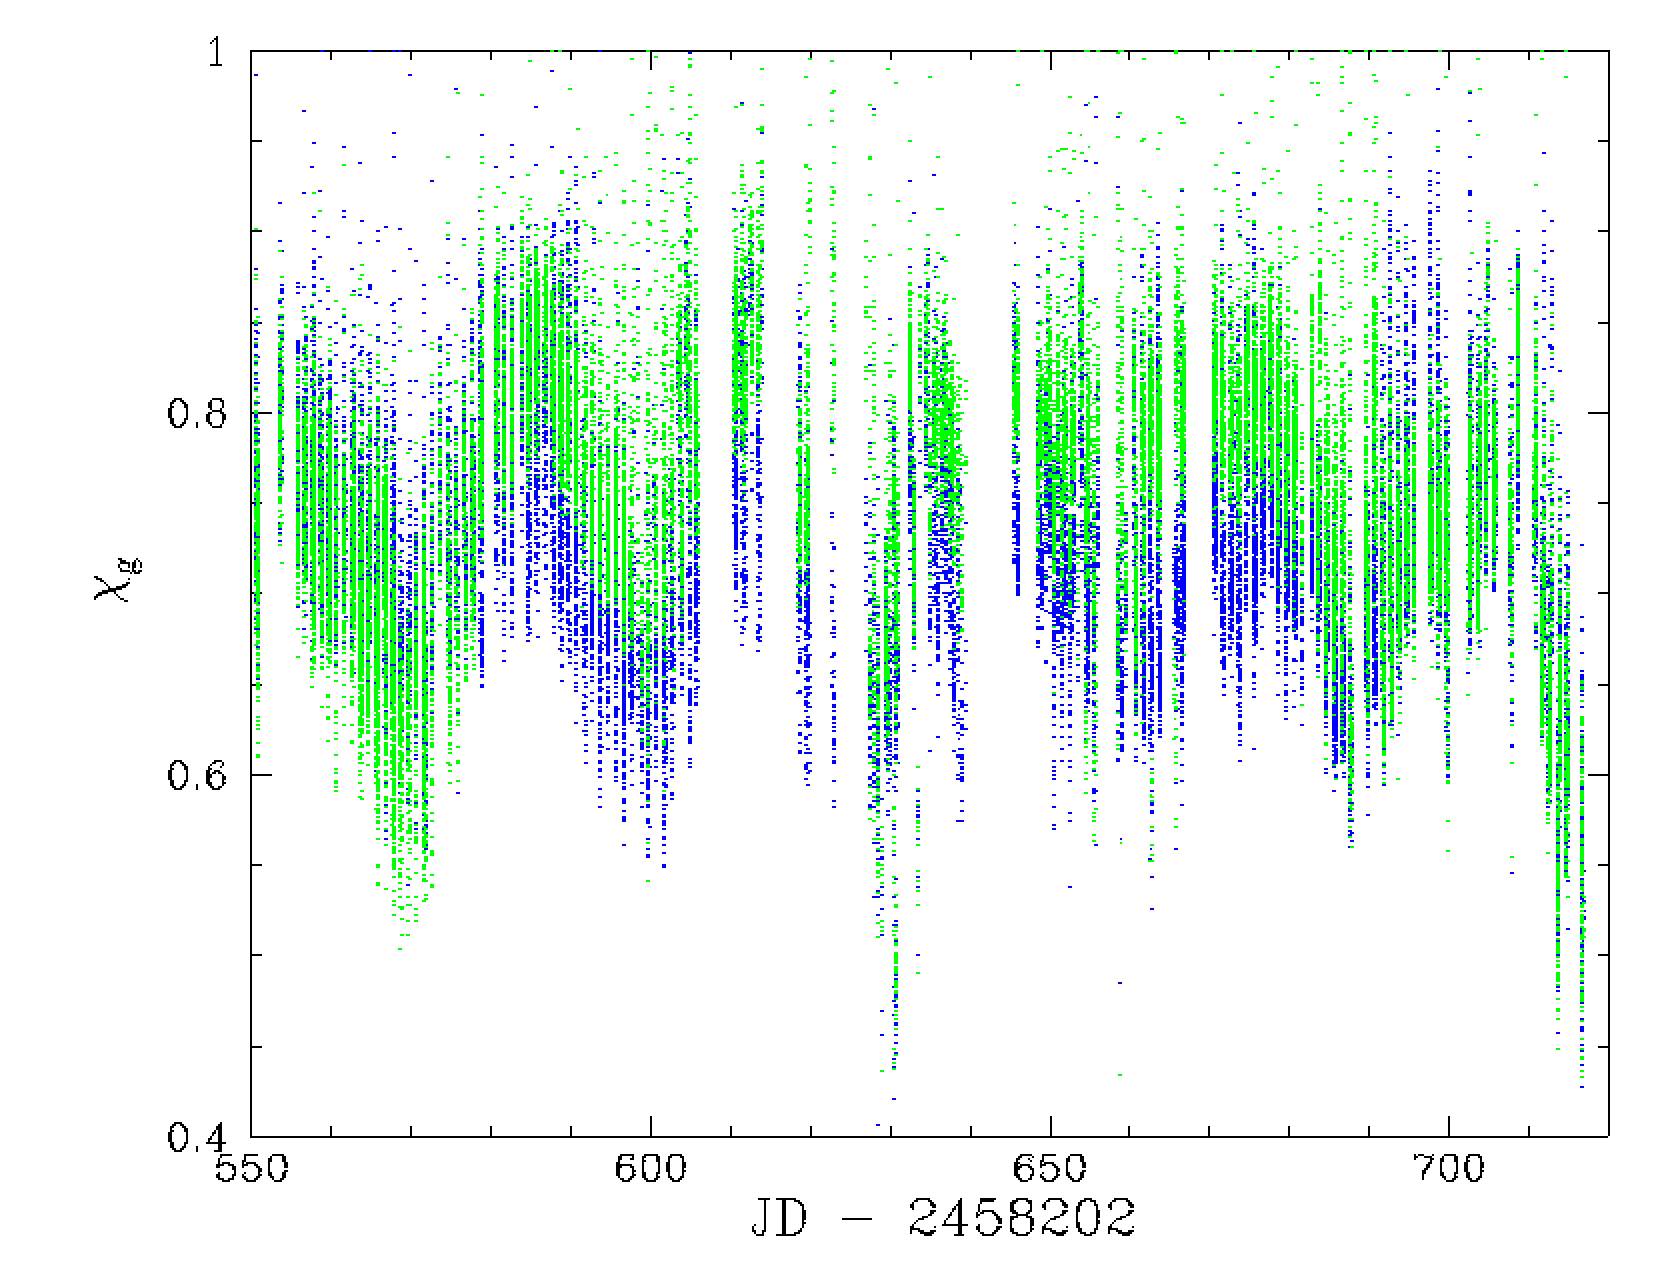
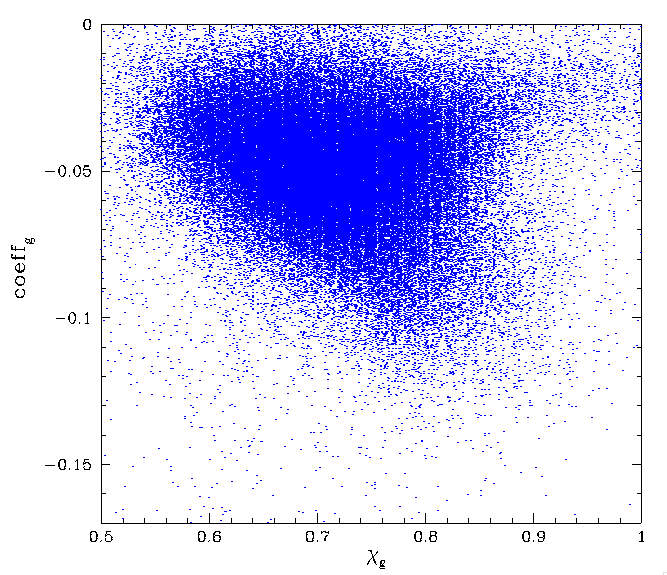
However, when we look at the values of the daophot PSF fit chi values above we see that the CCD 7 and CCD 6 values also diverge on 2019-10-23. With more recent data we see the CCD 6 data goes from generally having lower chi values than CCD 7 (after 2019-10-23), to higher values.
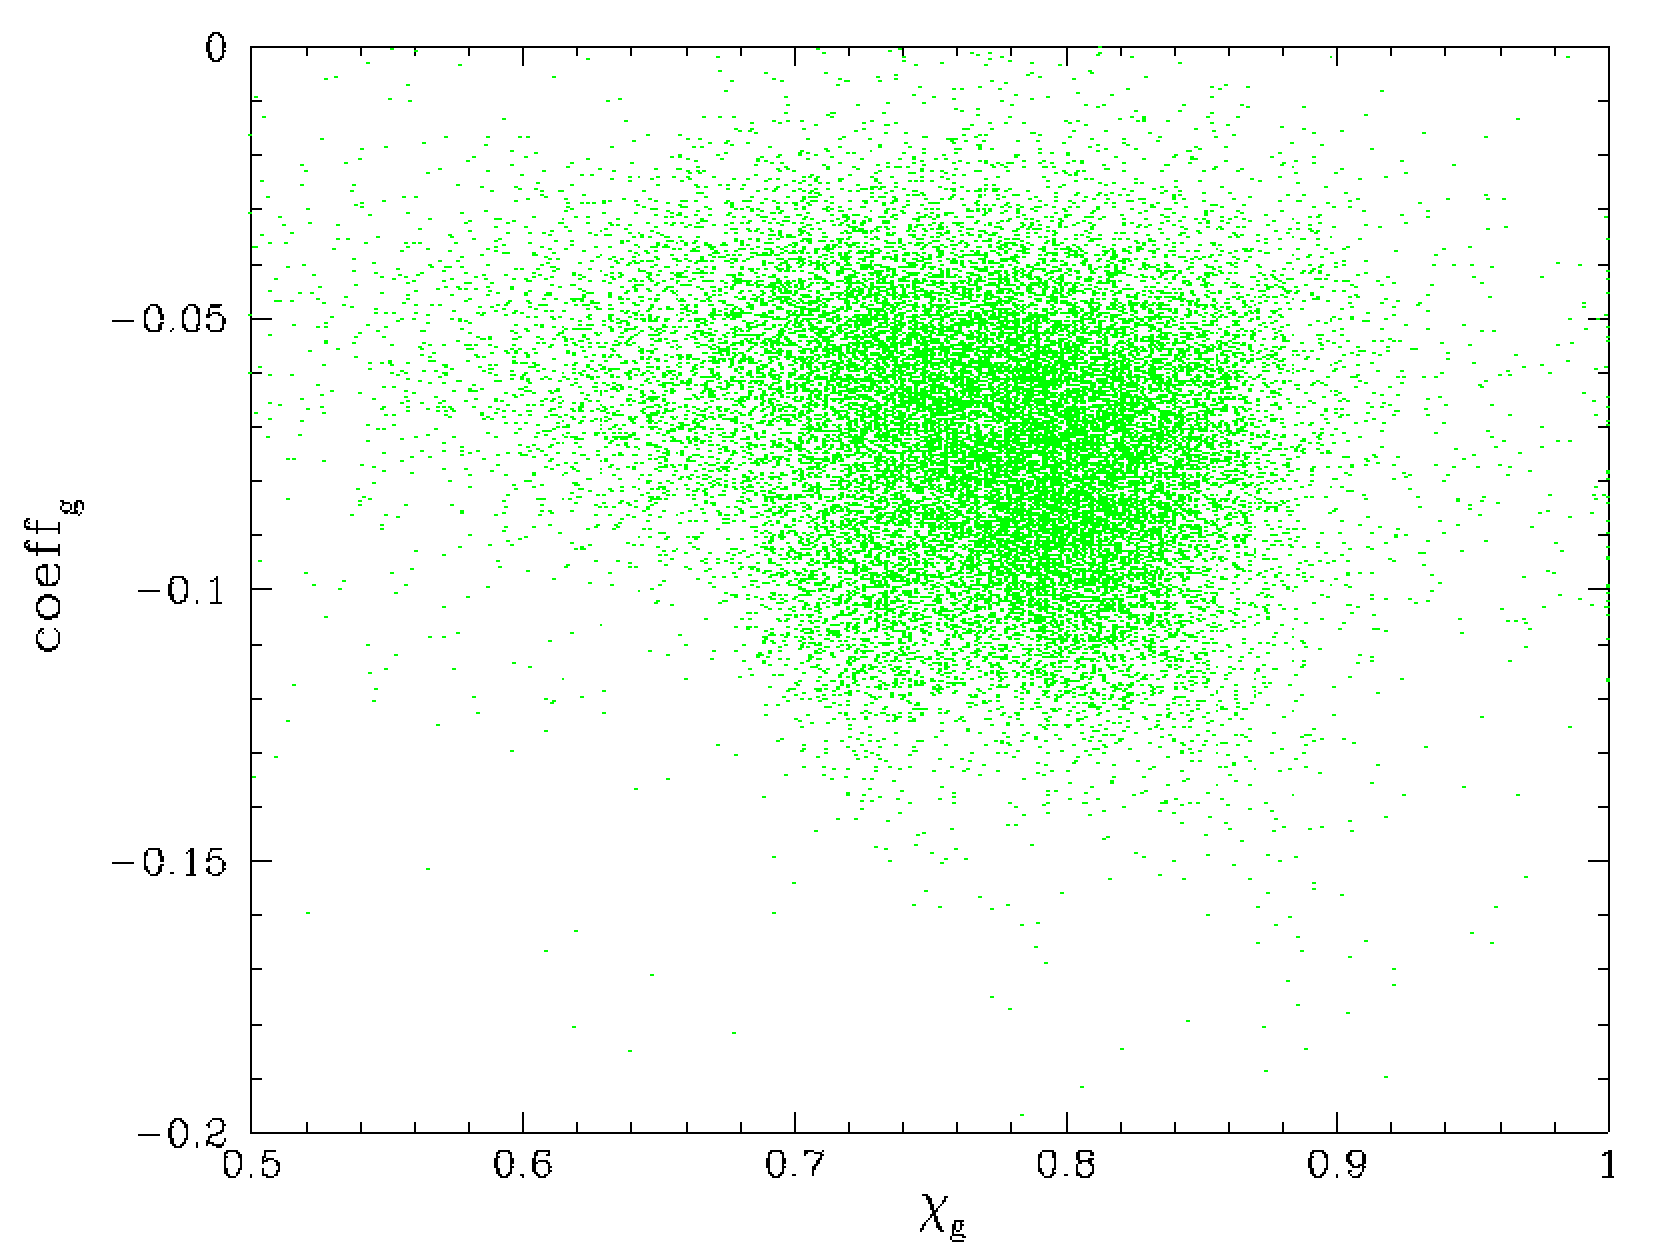
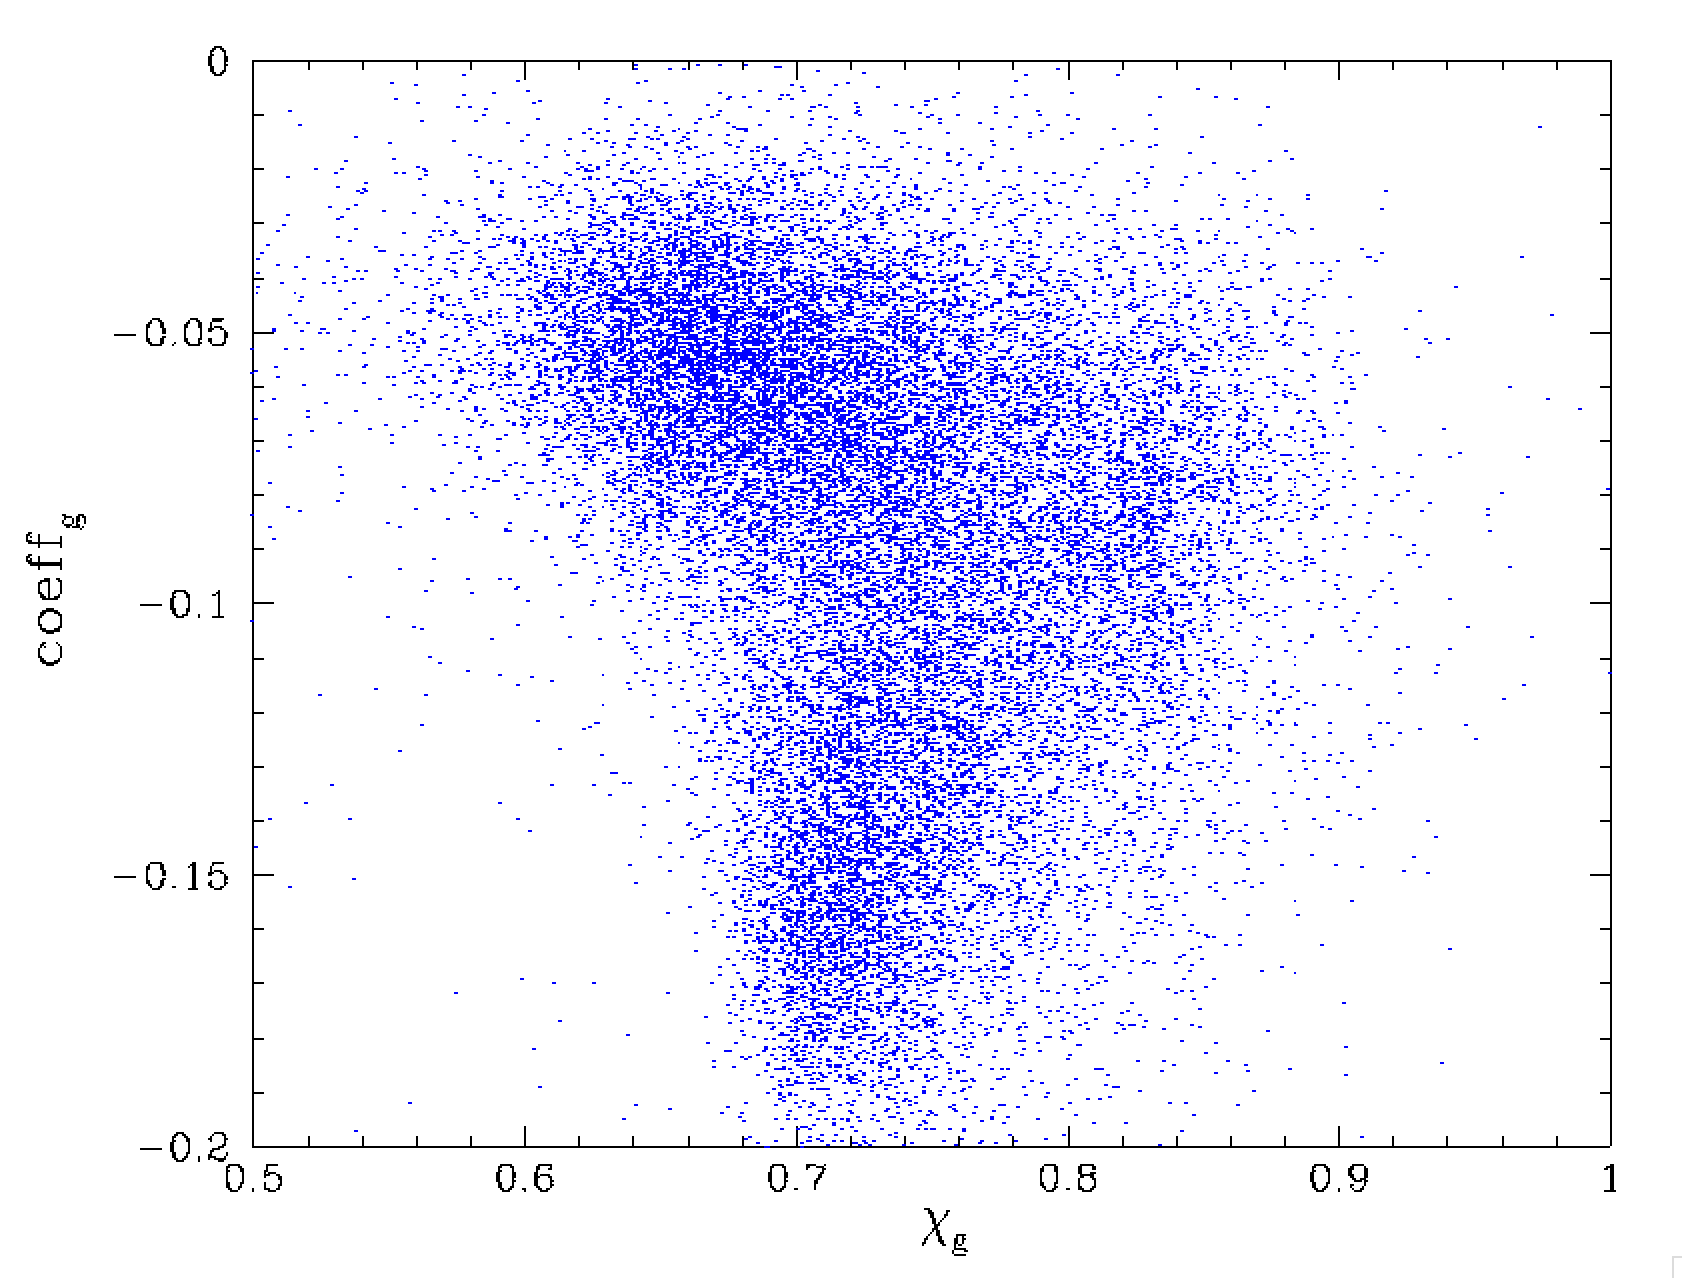
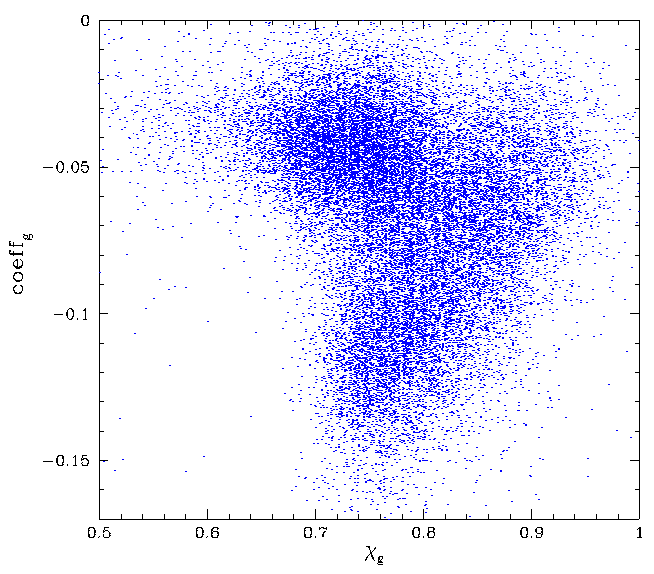
In the plot above we show the values of colour coeffs and PSF fit chi taken after 2019-10-22. Here we see that the CCD 6 and CCD 7 distributions are very different, with the CCD 7 values following the expected range (same as prior data).
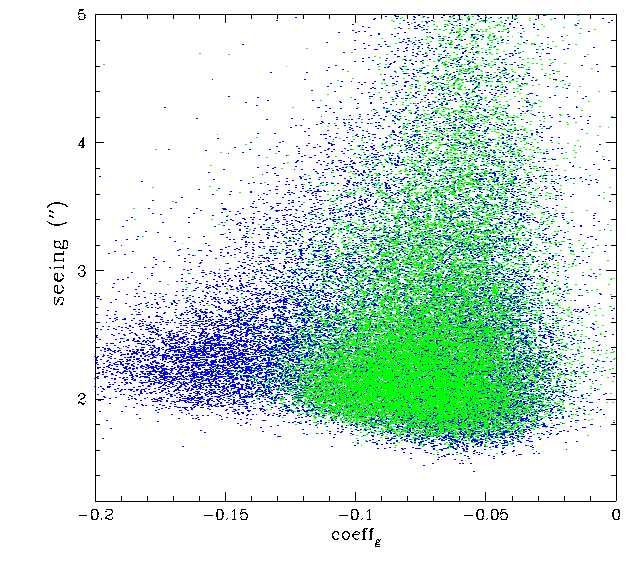
In the plot above we see that the problems with the colour coefficents only occur in a specific range of seeing (~1.9 - 2.5 arcseconds). The distribution of coefficients is very different than in CCD 7.
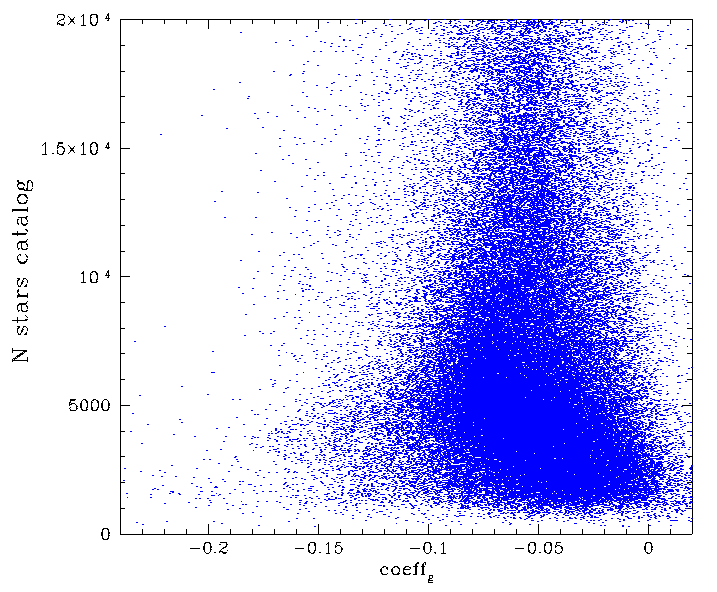
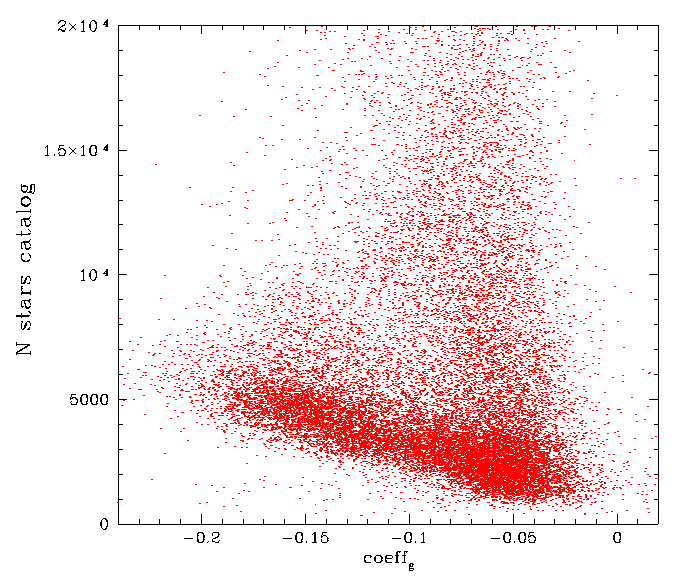
Comparing the plots above we see that the low values of colour coefficient in CCD 6 generally occur in fields with more stars. A similar trend is seen in CCD 7 data. However, the effect is much more exagerated in CCD 6.
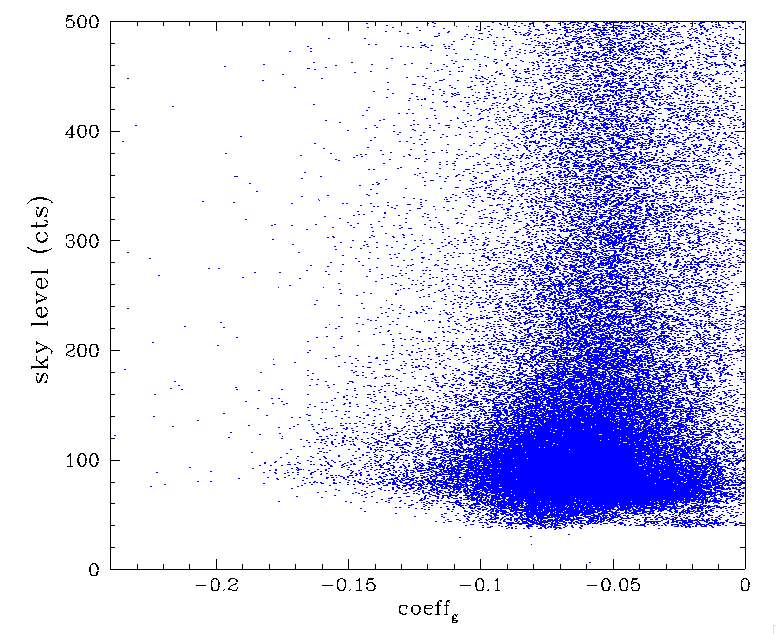
In the plot above we see that the unexpected value of colour coefficients only occur at low values of sky level. Similar dependence of colour coefficients on skylevel and the density of stars is observed in prior data. However, here the effect is far more significant.
Checking Photometric Parameters in Other CCDs
In the plot at the top of the page we can see that CCD 6 in not the only CCD where the residual structure has increased in 2020 compared to 2019. We selected RC 49 (CCD 13, q2) as another location where the residuals had increased. Note, we did not select CCD 13 q1 since it is a corner quadrant where vigneting effects are known to be significant and uncertainties are thus larger.
Comparing the values in plot with the CCD 6 q1, we see a significant change in colour coefficents also occured after 2019-10-22. Note, in the above plot we have offset the CCD 7 q1 colour coefficients to account for the systematic variation between quadrants discovered earlier.
In the plot above we see how the distribution of the photometric calibration changed after 2019-10-22. The values of the colour coefficients do not vary as much as they did for CCD 6 q1. However the variation is still very significant.
As with the distribution ZPs above, the distribution of chi values vary significantly before and after 2019-10-22, suggesting a change if the shape of the PSF which may be related to a change in the colour sensitivity.
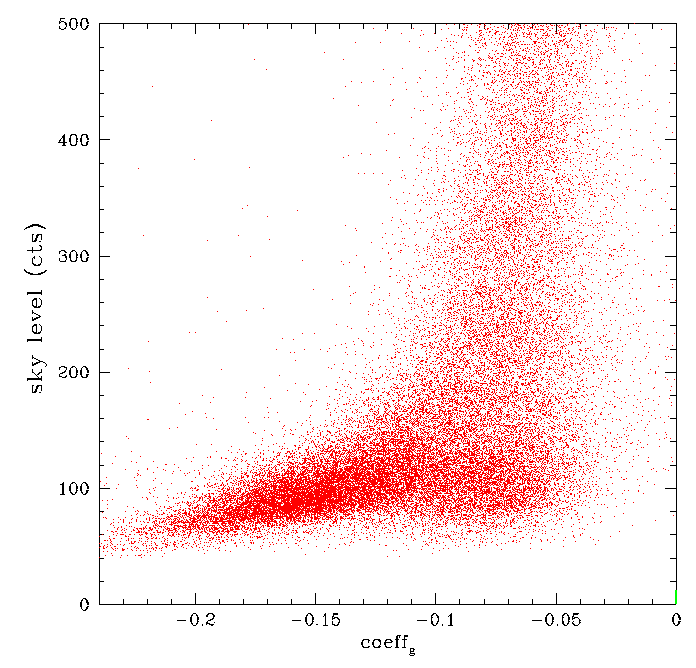
A strong dependence of the photometric colour coefficients is seen on the stellar density and sky level for CCD 13 data as it was in CCD 6.
Further tests of nightly photometry
In order to further investigate the photometric variations between 2019 and 2020 we selected three nights with varying colour coefficents that appeared to be moderatately photometic. These were 2019-03-30, 2020-02-24 and 2020-03-06. Here the first two nights show normal values of colour coefficients, while more than half of the g-band frames from 2020-02-24 have colour coeffs < -0.15 (suggesting a significant problem).For each night we remove photometry for where ZP < 26.0 (suggesting the possible presence of cloud). Since the individual frame zero points varying with airmass, stellar density, field, etc., we subtract the averge ZP for each frame and combine the photometry. Here we compare the well behaved CCD 7 q1 photometry, with that of CCD 6 q1.
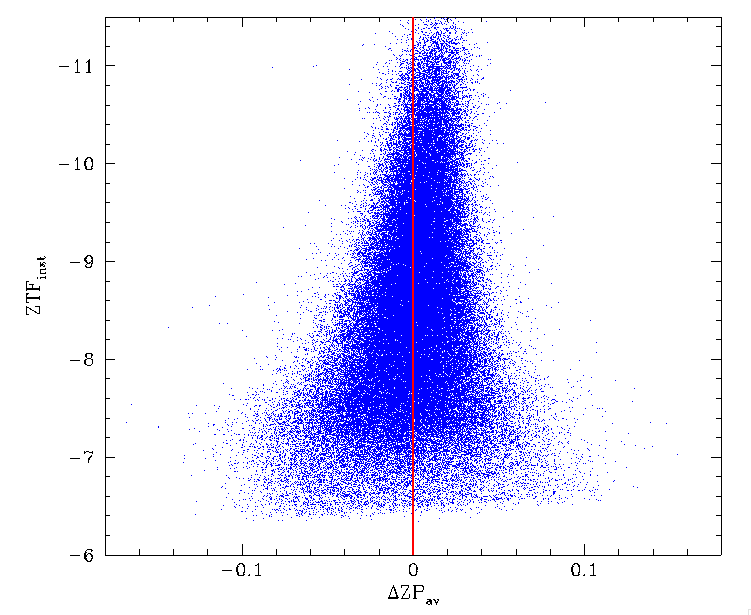
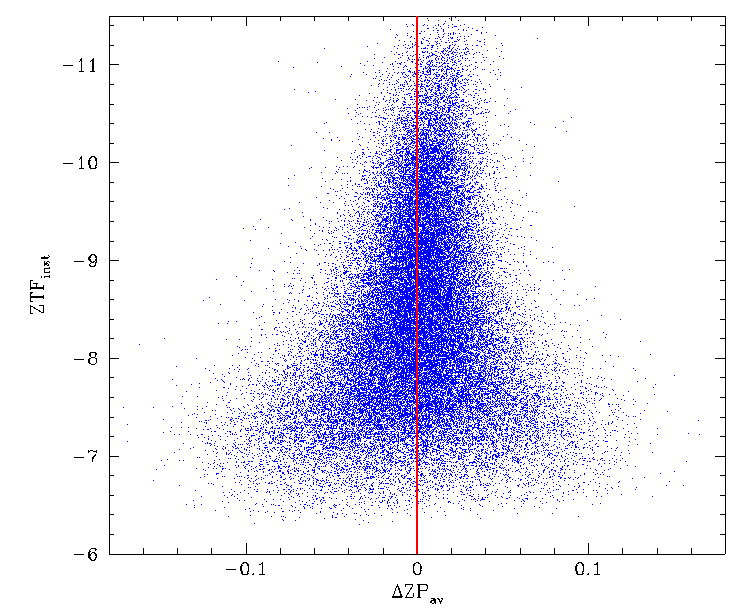
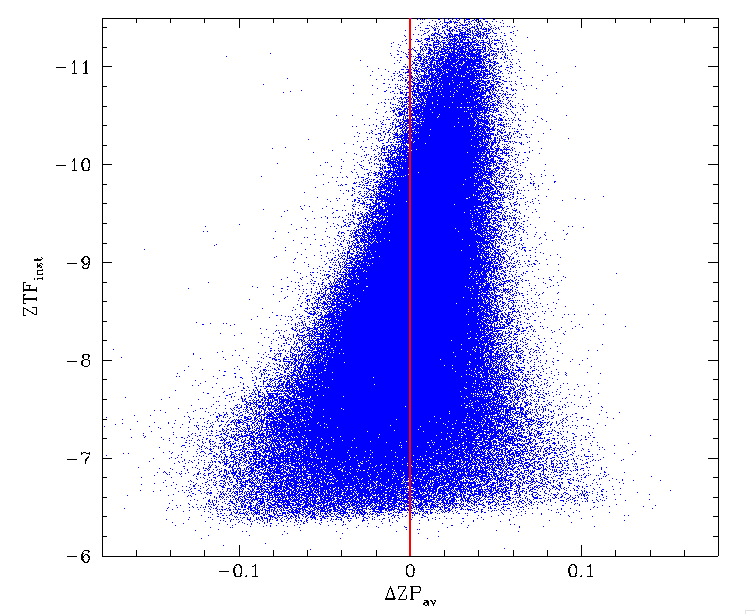
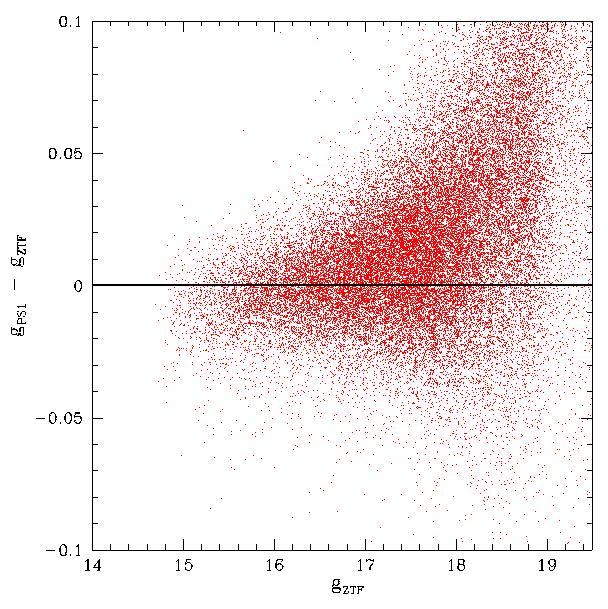
In the plots above we see that the photometry for CCD 7 is moderately well behaved. However, the magnitude bias is twice as large on 2020-02-24.
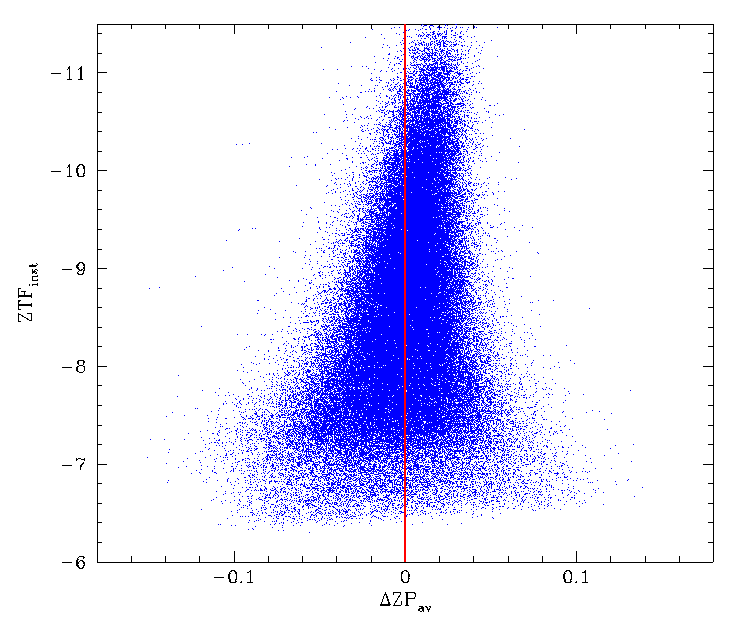
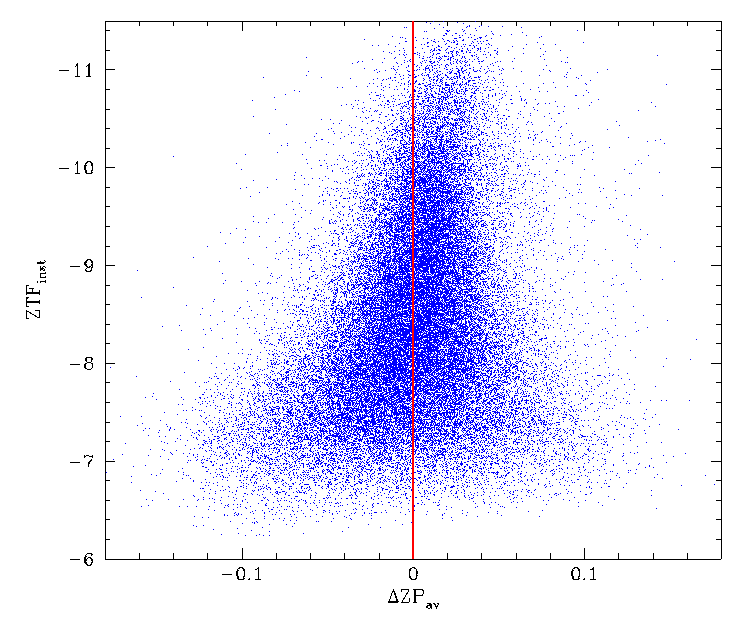
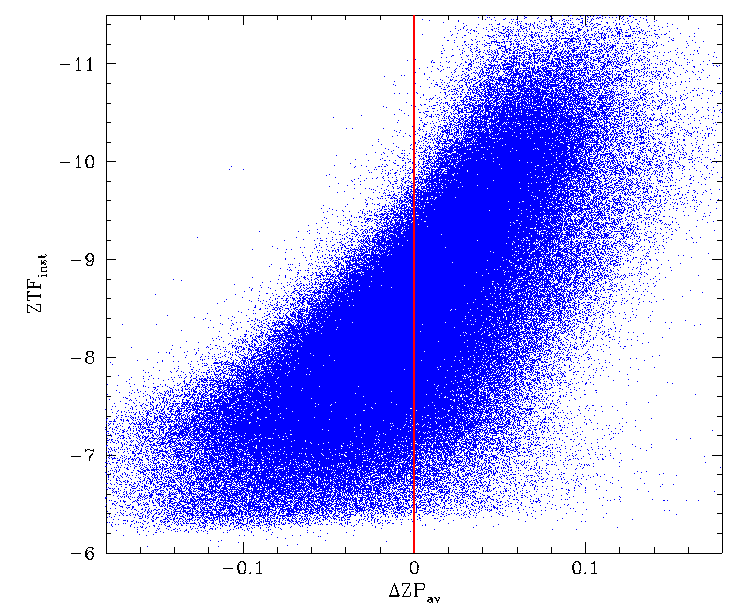
In the plots above we see that the CCD 6 magnitude bias is slightly larger on 2020-03-06 than on 2019-03-30. However, the bias is extreme on 2020-02-24.
To check how well the colour coefficents fit the photometry we plot the trends with PS1 (g-r) colours below.
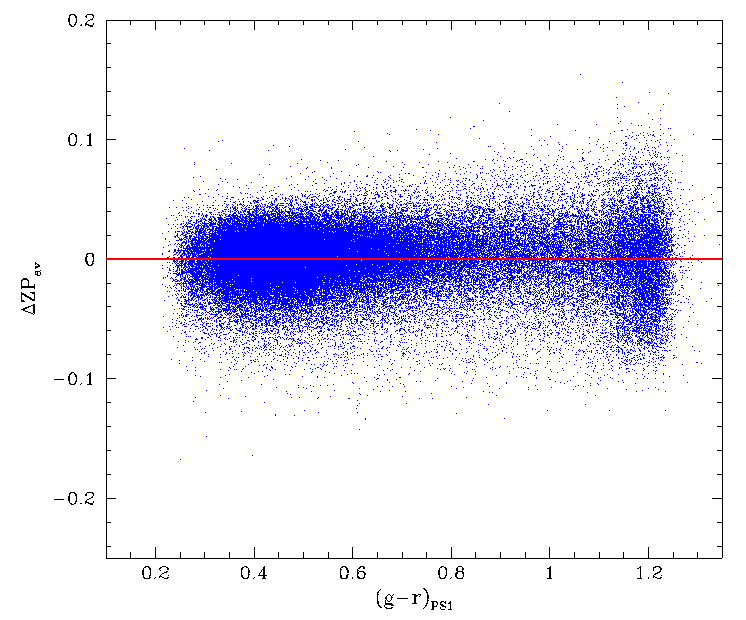
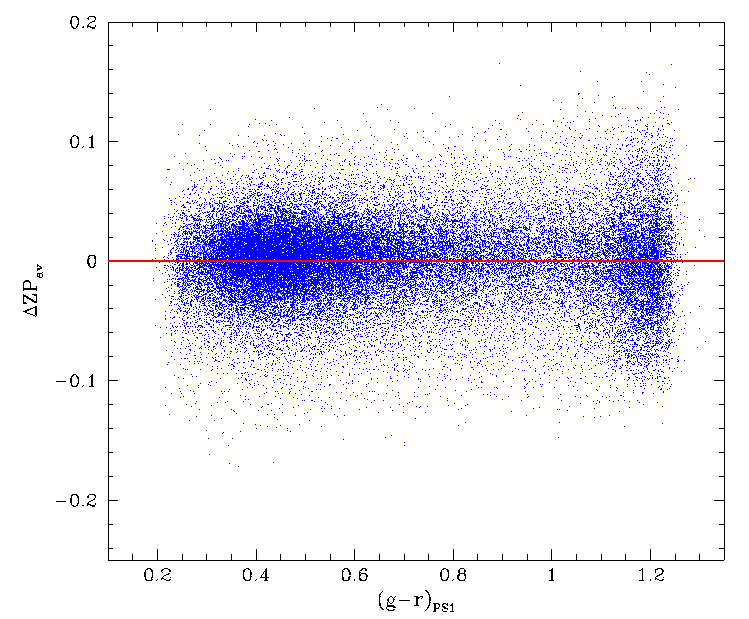
In the above plots of CCD 7 we see that there is very little sign of a trend in the first two "good" nights, while on 2020-02-24 there is a clear trend with slightly greater scatter.
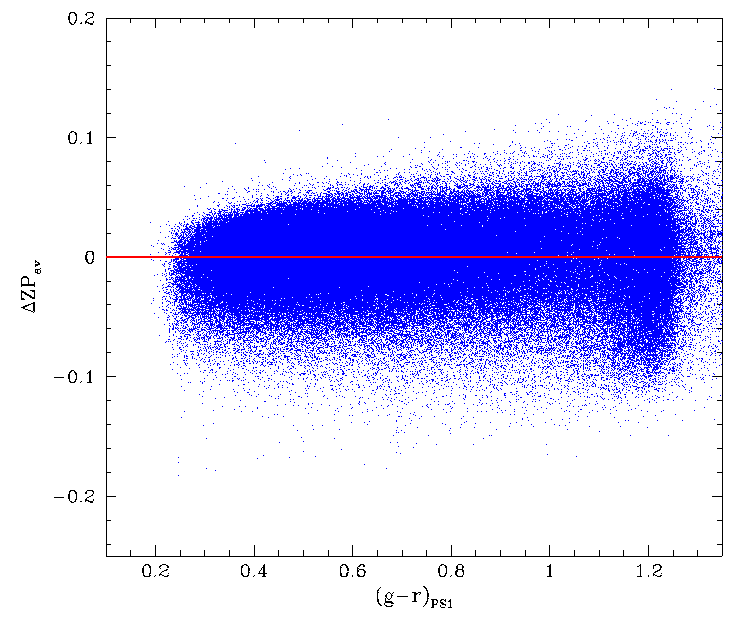
In the plots above we see that, as with CCD 7, the data for CCD 6 is quite well behaved for the fist two nights. The last night shows very significant residuals. Nevertheless, overall we can say that the magnitude trend is not due to poorly fit colour coefficents. Rather the trend is a real feature of the data.
Gain Variations with Skylevel
The plots above show that CCD6 has a significant residual that varies with the sources apparent magnitude. However, our plots of sky level vs colour coefficient also show a strong correlation. It is worth considering whether the residual slope is fixed or varies over time as the skylevel is expect to vary over time.We carried out a Zubercalibration of the 2020-02-24 data using fits terms for ZP, slope, airmass, r-i, reddening, chi, sharp and mag^2. We then divide the data wiht time into six subsets and looked at the resulting residuals.
In the residual plots above we clearly see that the slope of the residuals with magnitude changes over the span of the observations. This is particularly noticable at the bright end.
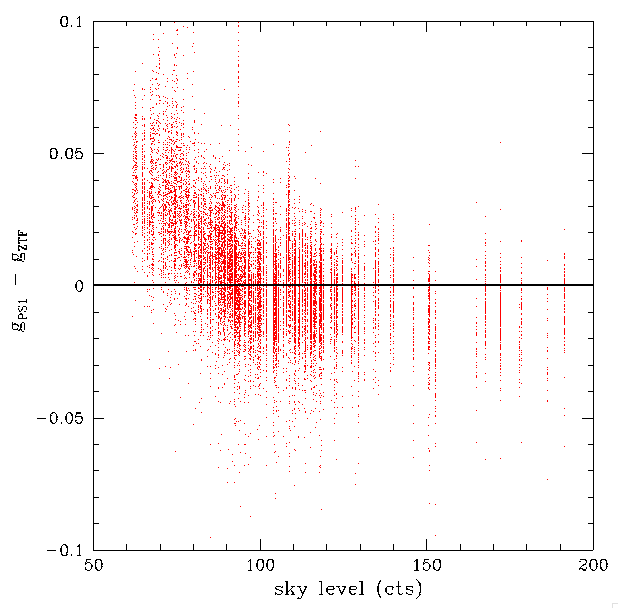
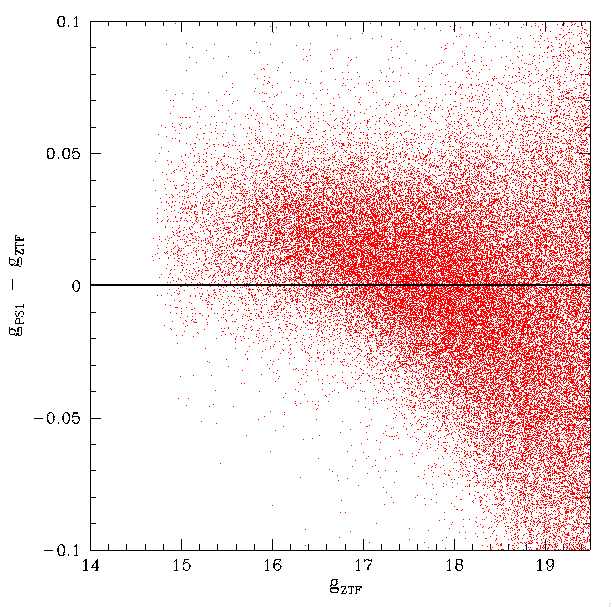
Variations in g-band calibration residuals for ZTF compared PS1 for CCD 6 q1 as a function of sky-level for stars g < 16.
When we examine just the bright stars, we see that the residual varies with the background level. That is, the slope of the residuals is dependent on the skylevel. This dependency drops when the skylevel is greater than approx 120 cts. We noted a similar slope variation with the number of calibrators. However, using ncalibrators in place of skylevel provided poorer fits.
Based on the data above we clearly cannot properly calibrate this photometry without taking the variation in slope into account. The current calibration attempts to correct for the presence of a slope by increasing the colour coefficient (since the colour of the calibrators varies with magnitude and field). However, since the effect itself is not due to colour, it cannot significantly reduce the slope.
We note that a strong effect was already known for g-band data. However, it wasn't known that the skylevel effect changed the slope and hence the magnitude dependence.
Further investigation shows that this effect is also present in earlier data and all other CCDs to a lesser extent. The magnitude bias corrections are fixed and thus do not account for this effect. Additionally, it is worth notely the the mag^2 term is required to calibrate the CCD-6 data, suggesting that the gain becomes non-linear.
Discussion
The flatfield ratio anaylsis above shows, as expected, that the response of CCDs 5 and 6 did not significantly change in g-band between 2019 and 2020.The ZTF camera has undergone many changes to CCD setup (read out waveforms, timing, linearity corrections) during ZTF-I. One of the major updates was to the CCD readout waveforms, linearity, and saturation threshold on 2019-10-23. The changes in CCD 6 photometry clearly occur on this date and are thus almost certainly related to the changes that were made. The changes in photometry appear linked to low levels of sky background and moderate numbers of stars.
Inspection of a small number of images from CCD 6 and 7 did not show an obvious reason for the changes in colour coefficients or the PSF shape.
Further comparison of CCD 6 parameters with 13 suggest a similar, but less significant, change occured on multiple CCDs. This further suggesting a link to the camera updates.
Analysis of individual nights of photometry shows that there is significant variation over time. In particular the gain scale is wrong when the sky level is low. This cannot be explained by errors in the PS1 photometry since it is static and similar problems are not evident in prior data. The variations in the slope lead to errors in the "magnitude bias correction" that are currenly not accounted for. Based on data from 2020-02-24, these errors could be as large 0.1 mags.
Analysis show that a fit including skylevel must be used to remove the slope present in the photometric residuals. The presence of this slope shows why earlier corrections derived purely based on bright stars did not work for fainter ones.