| Topics |
|---|
| Spatial structure in all frames. |
| The r-band dependence of residuals of source colour. |
| The r-band time dependence. |
| Discussion. |
Spatial Residuals based on all r-band calibrators
Following on from our g-band analysis of spatial residuals we undertook the inital steps in the Zubercal process for all ZTF r-band data. First we processed and fit every ZTF-I night with r-band photometry (~730 nights). Then we derived the average residual relative to PS1 at each super-pixel (120 x 120 super-pixels per quadrant). Generally there are ~20,000 measurements per super-pixel at this scale. The results are very similar to average spatial residuals following our prior g-band work as can be seen below.
Blink all: ![]()
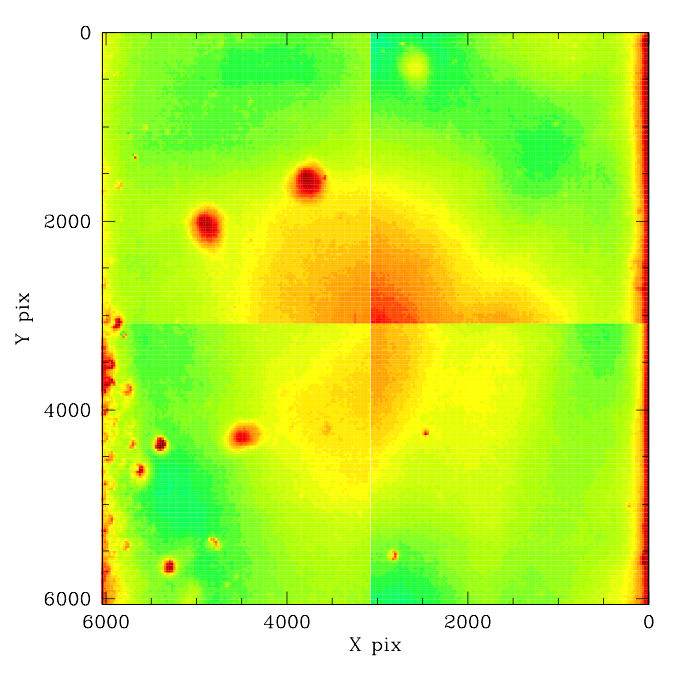
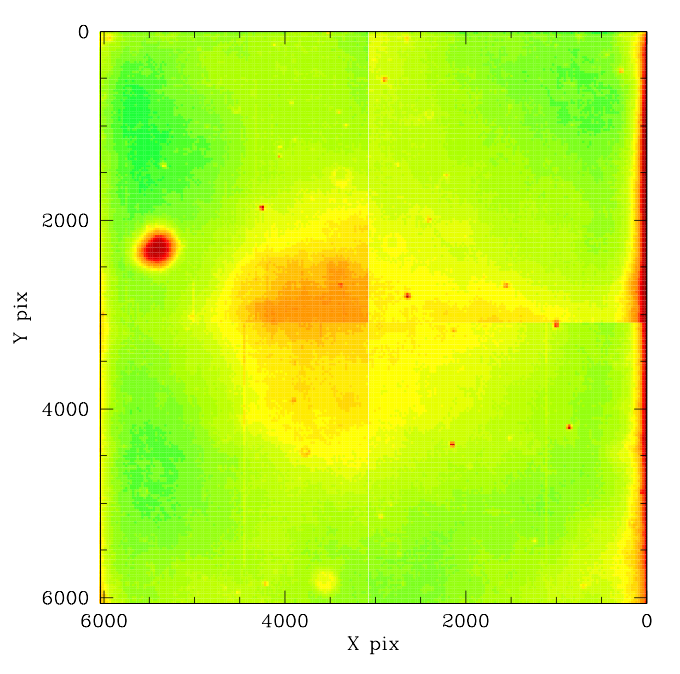
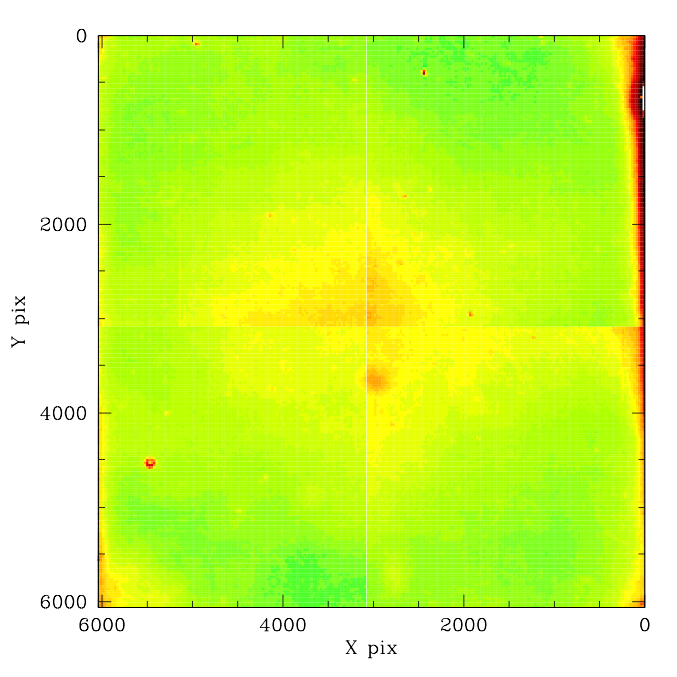
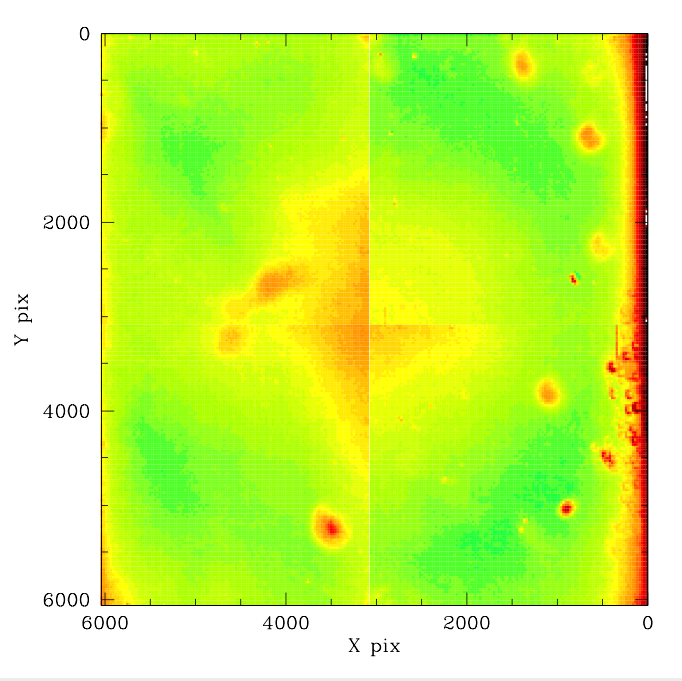
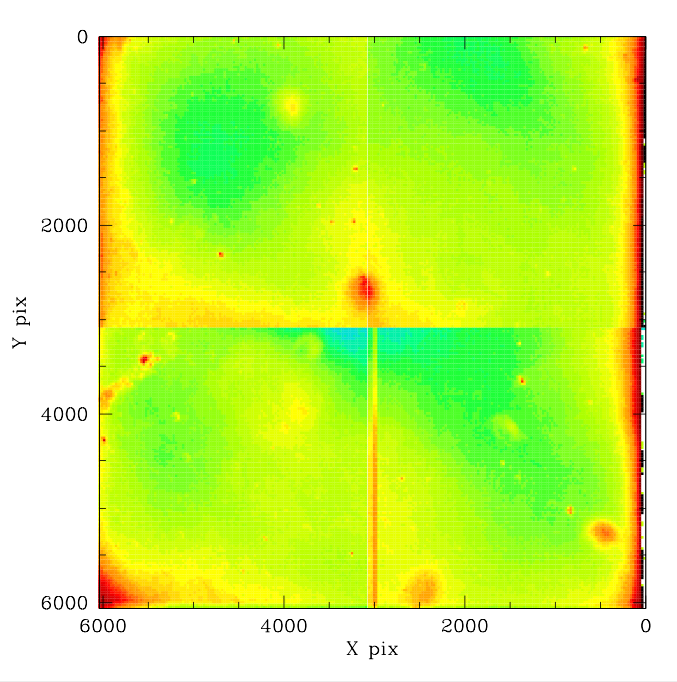
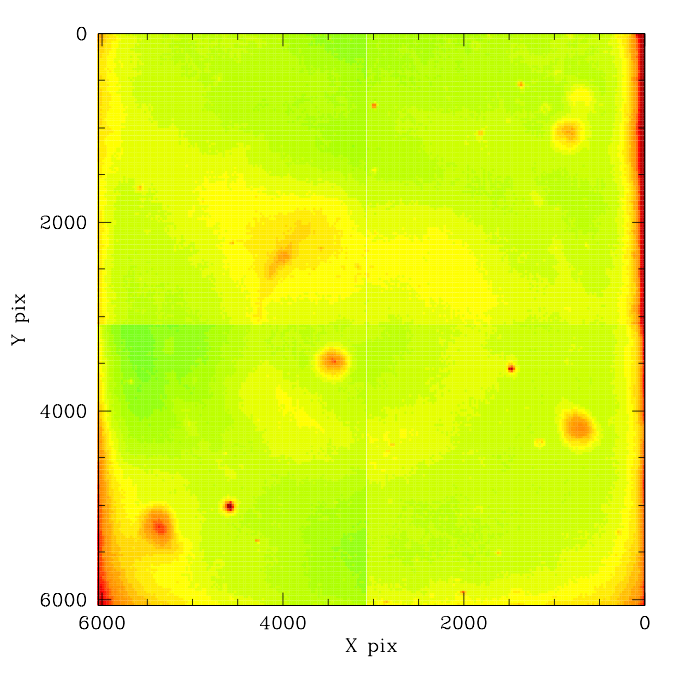
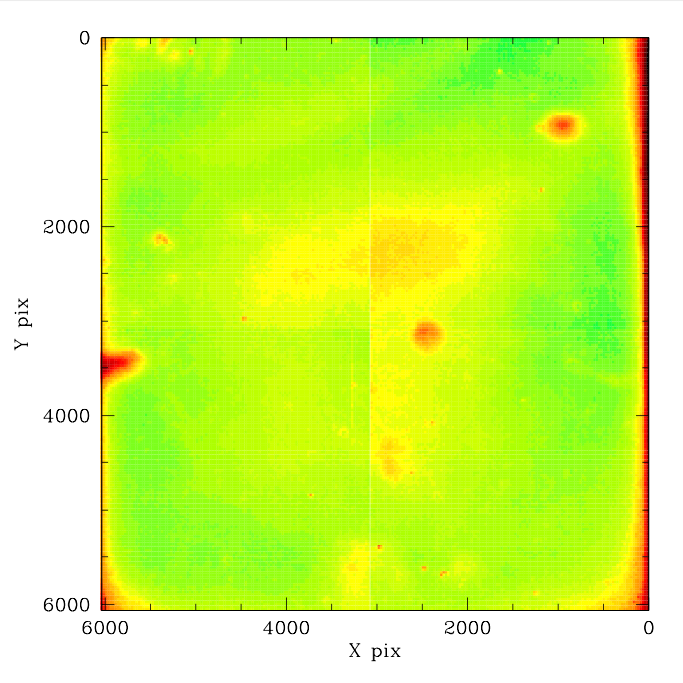
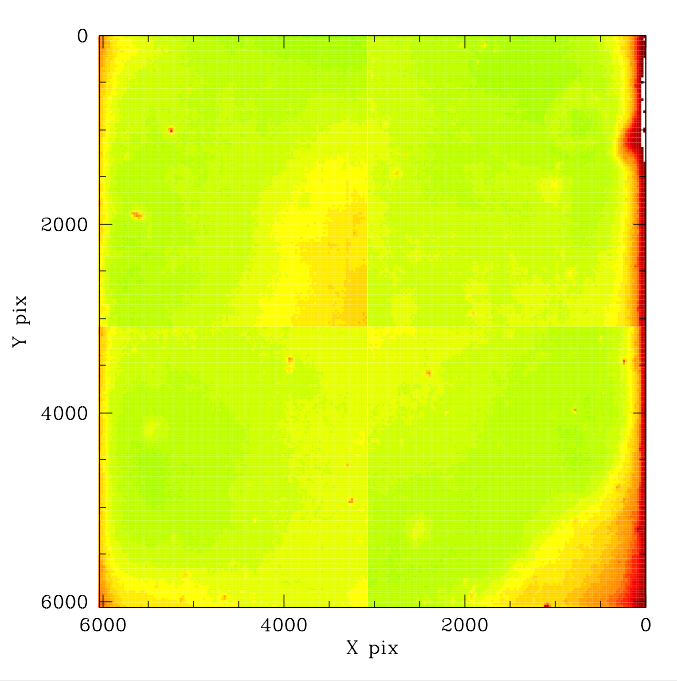
Blink all:
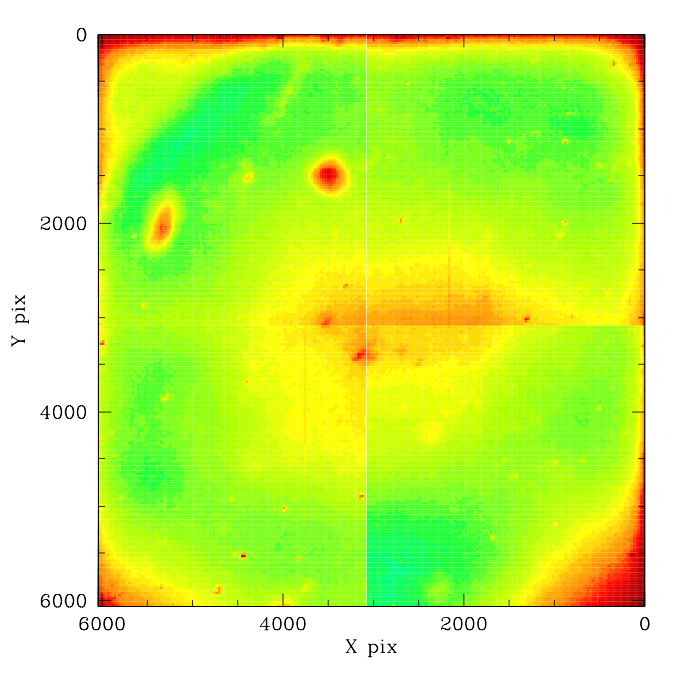
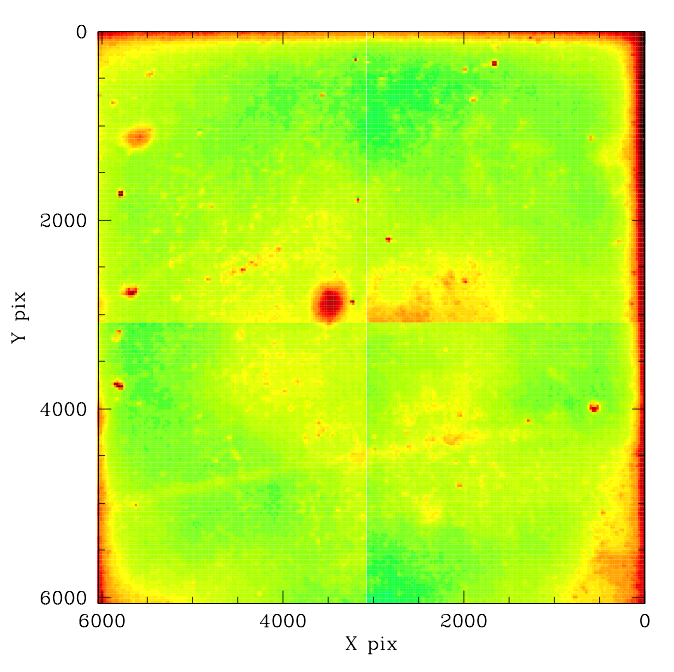
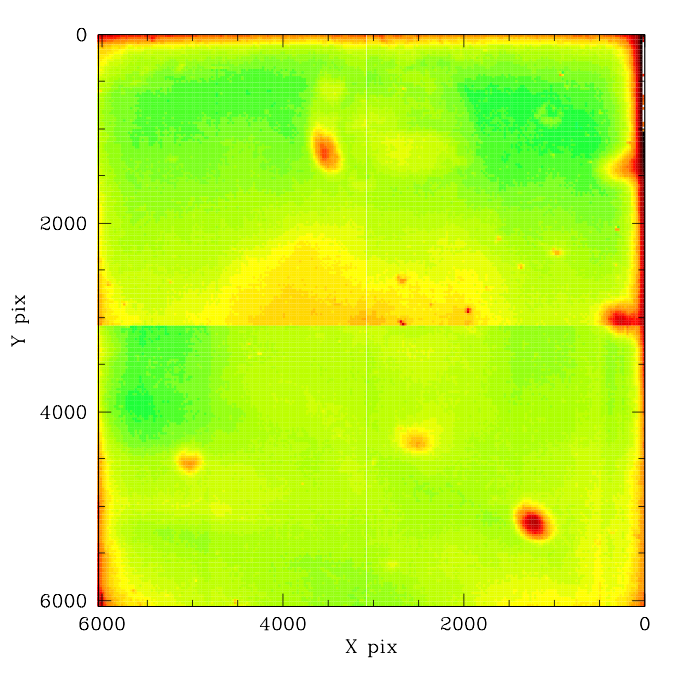
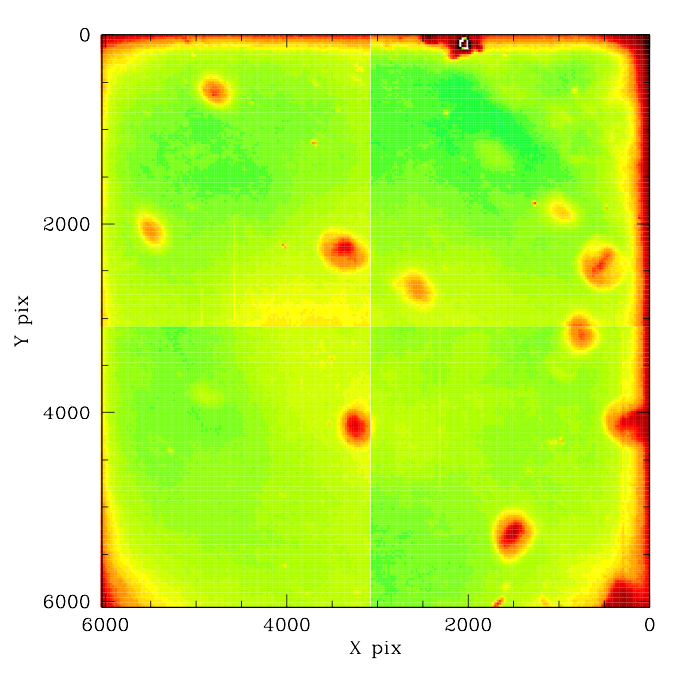
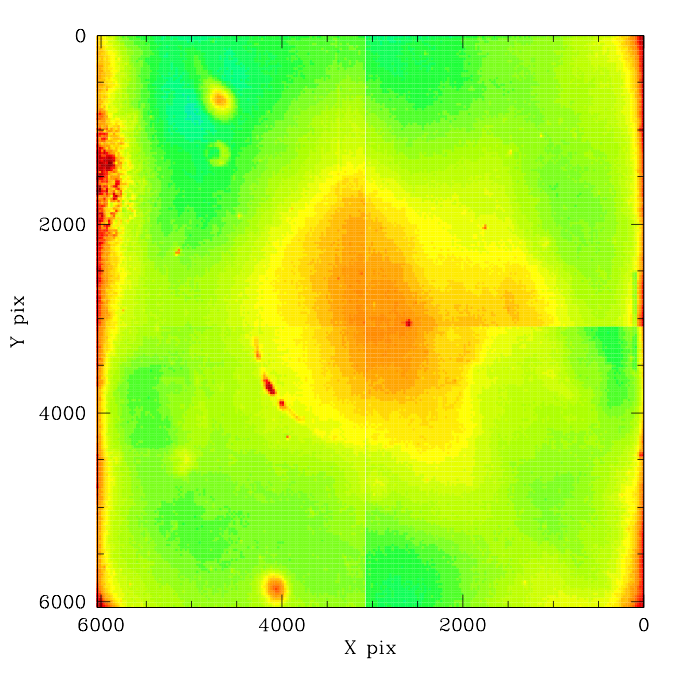
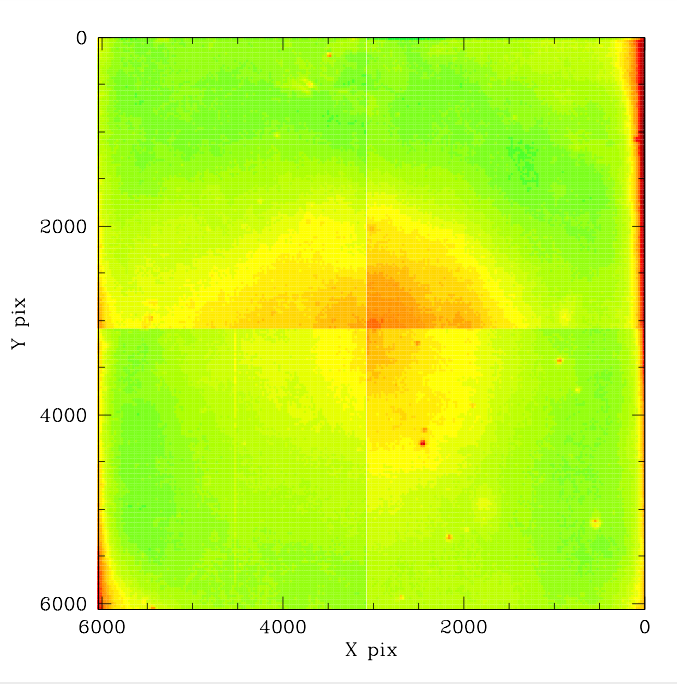
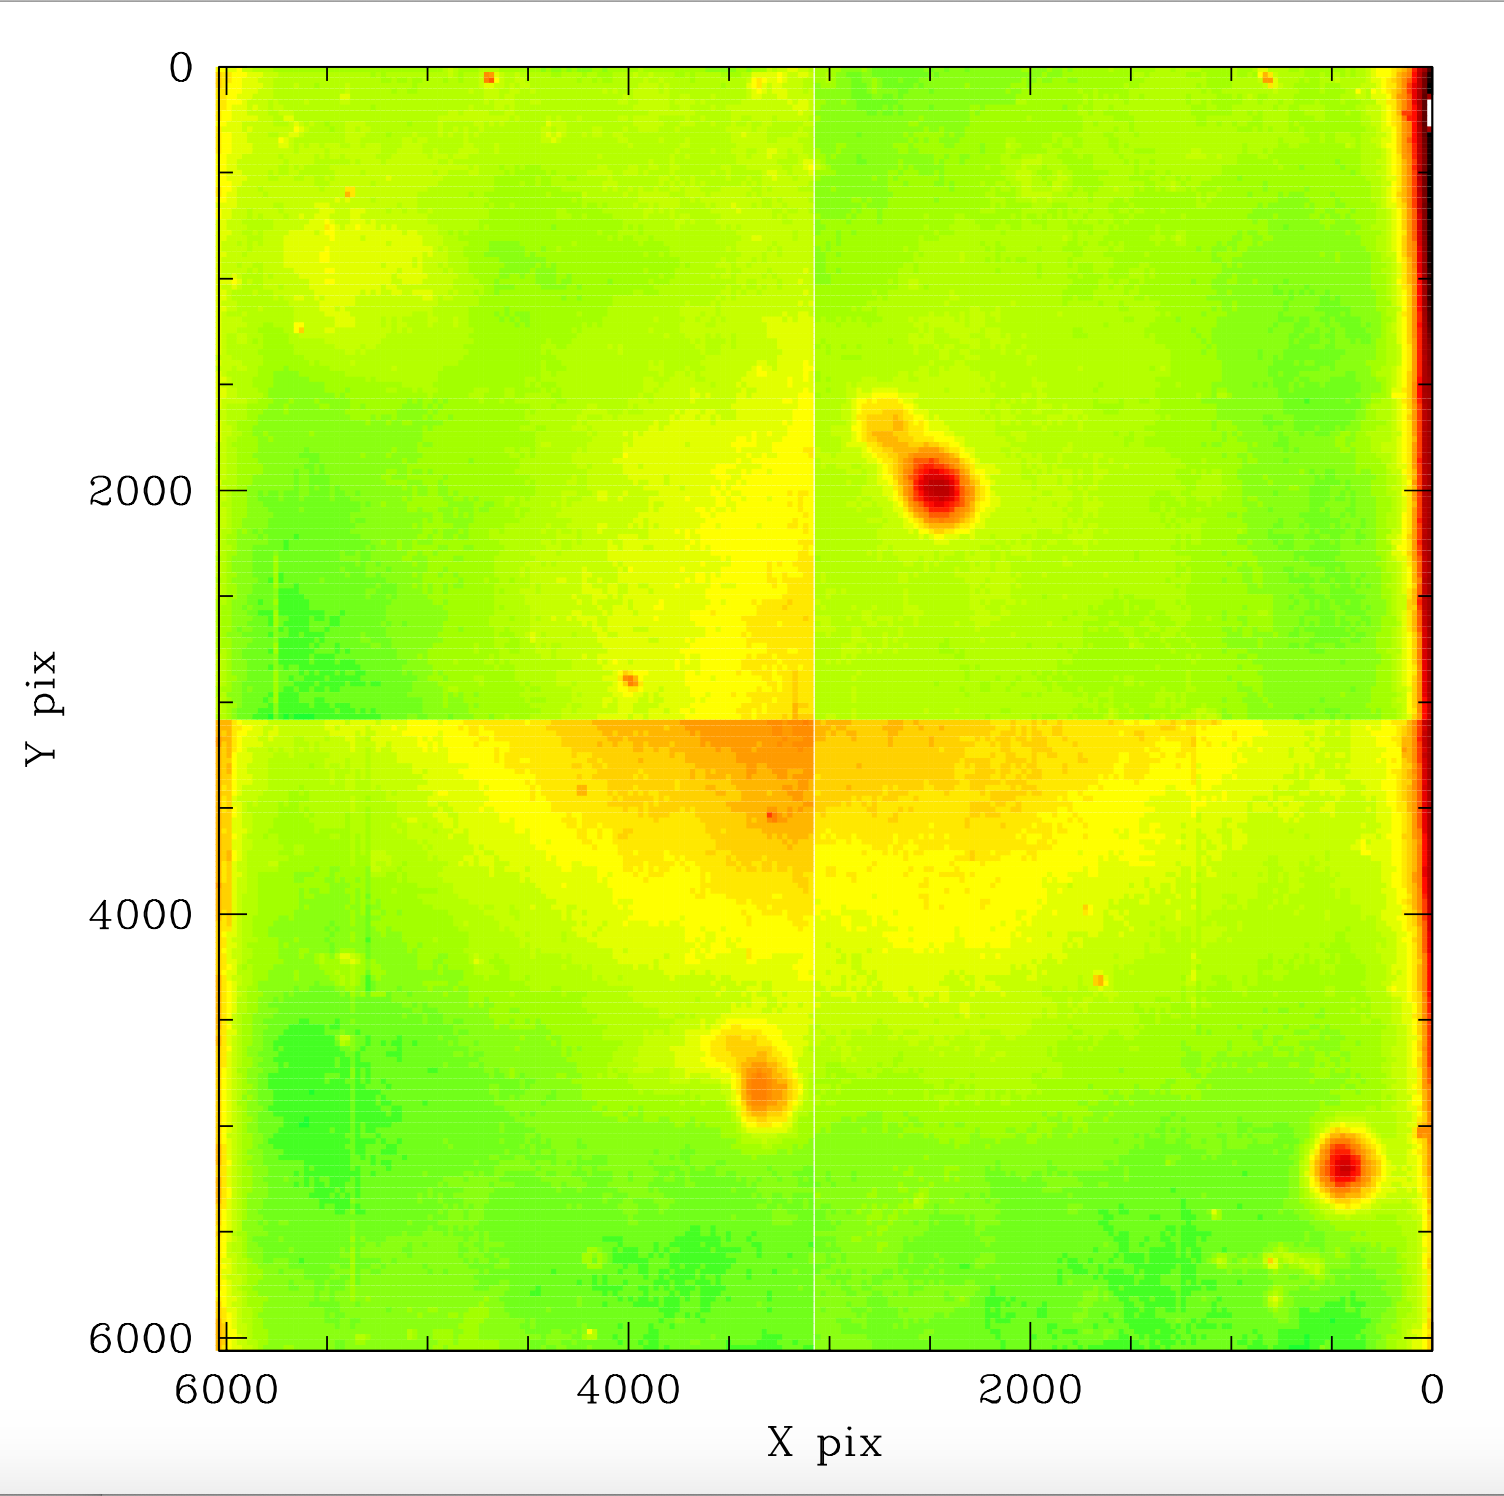
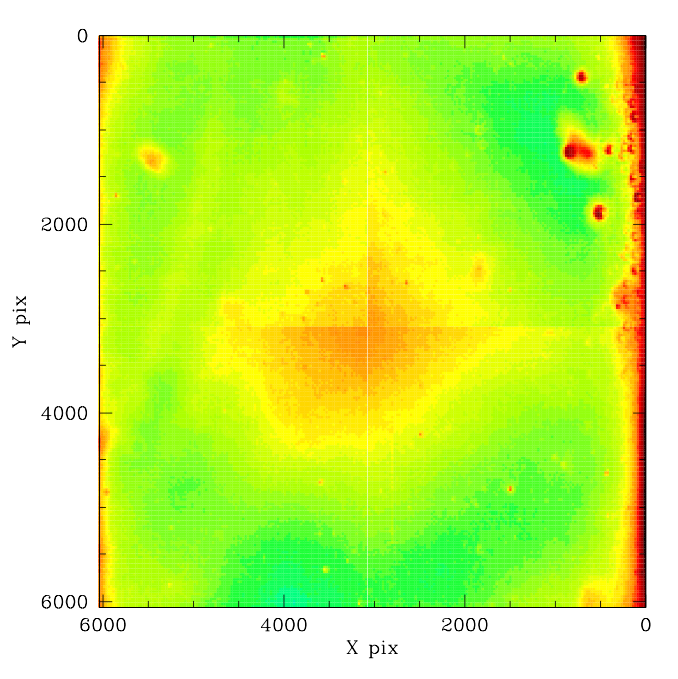
Above we show the high resolution r-band residual plots for all 16 CCDs based on all bright calibrator measurements in ZTF-I. Individual CCDs can be blinked for comparison using mouse over or click for high resolution versions.
In the plots above we contrast the new photometric error maps derived from all bright calibrator measurements in ZTF-I with our initial analysis based on 30 fields. As with the g-band maps, the new correction plots the appear to be accurate to ~1 mmag based on the level of spatial variation. However, there are much larger variations in the spatial residuals with time that are not corrected by using these maps. The result above can be contrasted with old residual maps.
The r-band Colour Dependence of Spatial Residuals for all CCDs
Following our prior analyses of the spatial dependence on source colour, we have determined the r-band residuals for all ZTF CCDs. Unlike our initial g-band analysis, where the colour dependence was determined on the CCD level, we determined to perform fits on superpixels (image binned to 30x30 superpixels per quadrant) since we know that dust spots and edge glints cause significant variations in response. In each case a fifth order polynomial fit appears sufficent.
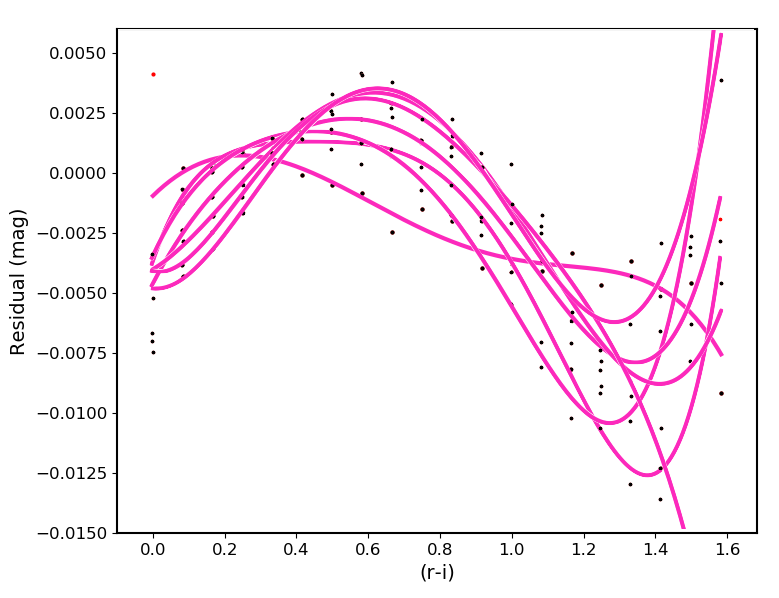
The r-i source colour dependence of residuals (r_PS1 - r_ZTF) relative to the average r-band photometric spatial systematics shown above for CCD 16 quadrant 1. The fit lines above correspond to superpixels at coordinates (1,1), (5,5), (10,10), (15,15), (20,20), (25,25), and (30,30) of the 30x30 spatially binned images.
In the plots above we show how the photometric residuals vary with source colour from the average based on all r-band photometry. Each superpixel colour point on the plots is the average over all pixels at that position across all fields. The obvious colour dependence is due to a combination of both the CCD and filter response which both vary relative to the PS1 as well as the presence of dust spots. The variations between the lines show how the response varies within a CCD. The fit residuals are typically 1 millimag.
Time dependence
Following on from our analysis of the g-band time dependence I have carried fit for the r-band dependence for all 16 CCDs. The fit is performed at the 30x30 super-pixels per quadrant image.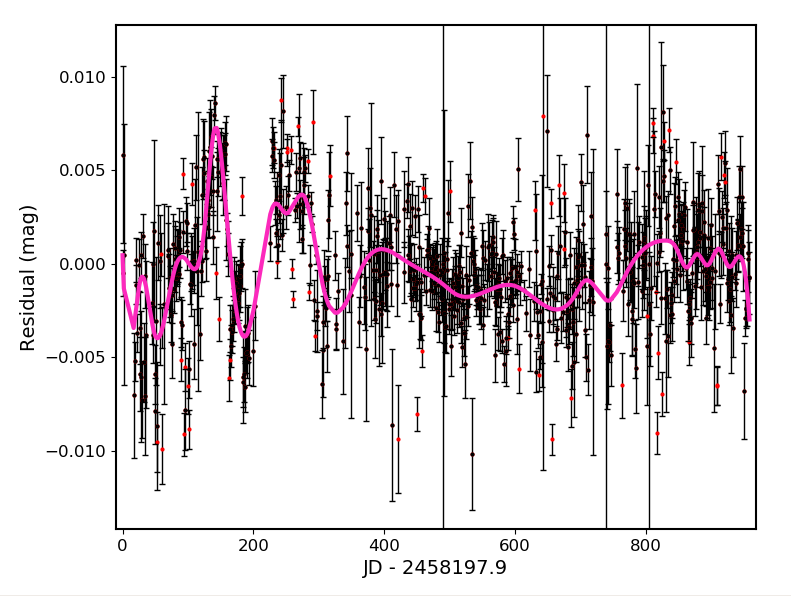
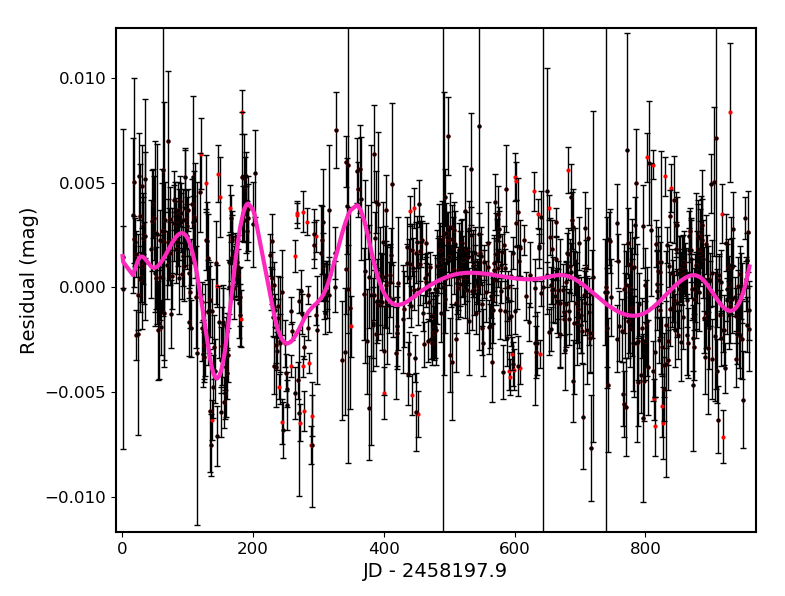
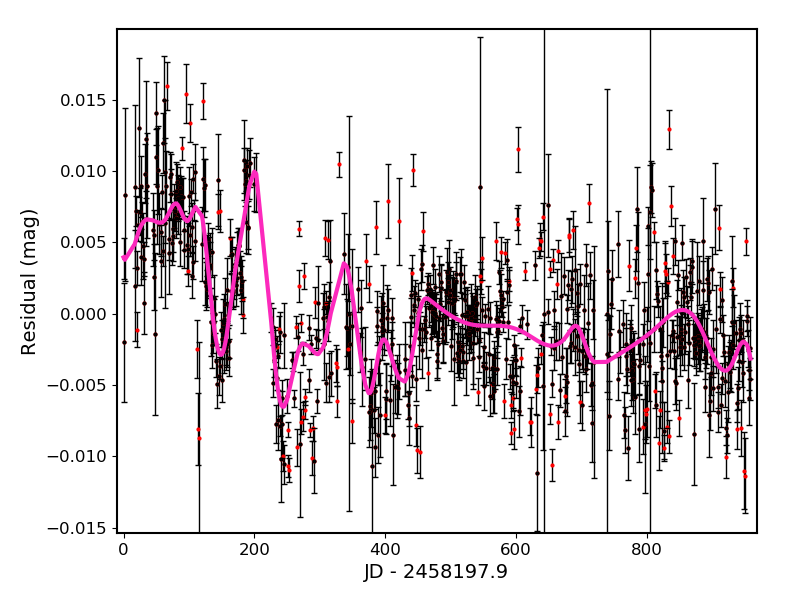
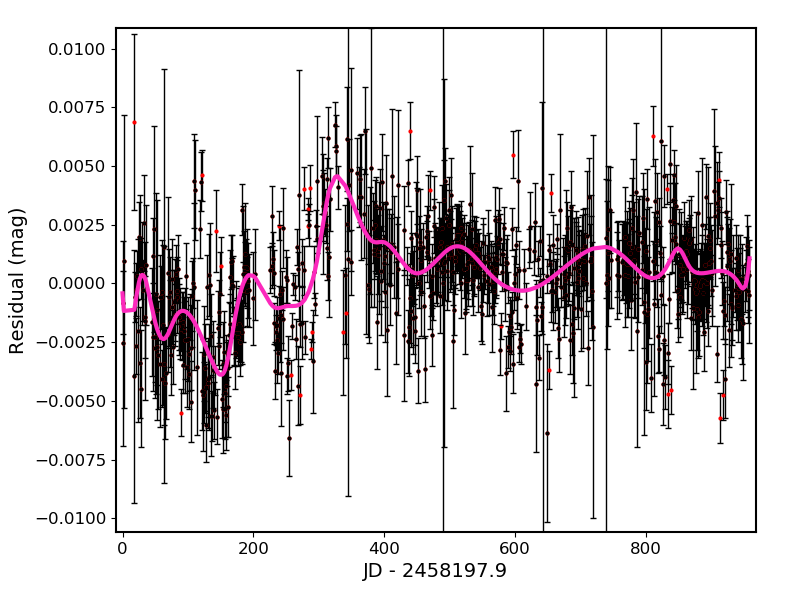
Temporal variations in the CCD-16 photometric residuals of ZTF r-band photometry compared to PS1. Left top: pixel (5,5), right top: pixel (25,25), left bottom: pixel (30,30), right bottom: pixel (20,20). The magenta lines are the fits after an initial 3.5 sigma rejection. The red dots are clipped points.
In the plots above we show the time dependence of the spatial structure at a number of super-pixels across a single quadrant region. As expected, pixels near the edge show the largest variations. Typically these are less than 5 millimags. This significantly smaller than in g-band.
In the g-band analysis we discovered that there were many cases were data were clipped. This is because the uncertainties were under estimated. Here we have corrected those errors. Additionally the 30 day (lunation) approach tended to over fit the data. Here we have modified the code so that spline knots are only placed where the data suggests that there are variations. We will redo g-band.
Discussion
We have completed our determination of the average photometric residuals in all CCD for ZTF r-band data. This data is used to match PS1 data and thus provide accurate magnitudes. However, since sources are generally repeatedly observed near the same position in a CCD, these corrections are not expected to greatly reduce the scatter between observations.We have completed our analysis on trends in residuals with source colour. The variations r-band in response are up to 1% and thus must be accounted for in the calibration process. These variations are much smaller than g-band. We have provided curves each superpixel (i.e. 900 per quadrant image). Thus over the full camera there are 57600 fits. These corrections are expected to account for most of variations due to filter transmission, CCD response and environment (dust spots, edge glints, etc.).
We have carried out analysis of the time dependence of ZTF r-band spatial photometric residuals. These are smaller than in g-band (as are the photometric residuals in general). We expect uncertainties at roughly a milli-mag level across most of the CCD away from the edges where glints vary from one night to the next.
The colour response and time dependence fitting must be applied to the g-band photometry since the corrections were at the CCD level for colour and better time-dependence fits are now possible. This is turn means that all the g-band surface fits must be redone.